Optuma Forums › Optuma Scripting › Larry Williams indicators
- This topic has 8 replies, 3 voices, and was last updated 1 year, 5 months ago by
Jonathan.
-
AuthorPosts
-
September 4, 2018 at 12:56 am #48055
Darren
- Topics: 62
- Replies: 521
- Posts: 583
Whilst we have the Williams %R and Ultimate Oscillator built in to Optuma it’s possible to add others using the scripting language. For example, the VIXFix indicator.
The indicator takes the highest closing price of the previous 22 trading days and subtracts the current low. This is then divided by the highest 22 day close, and then multiplied by 100. In Optuma, we can use the HIGHESTHIGH() function to recreate the indicator in our scripting language:
123456//Get the 22 day highHiClose = HIGHESTHIGH(CLOSE(), BARS=22);//Calculate the VIXFix((HiClose-LOW()) / HiClose)*100
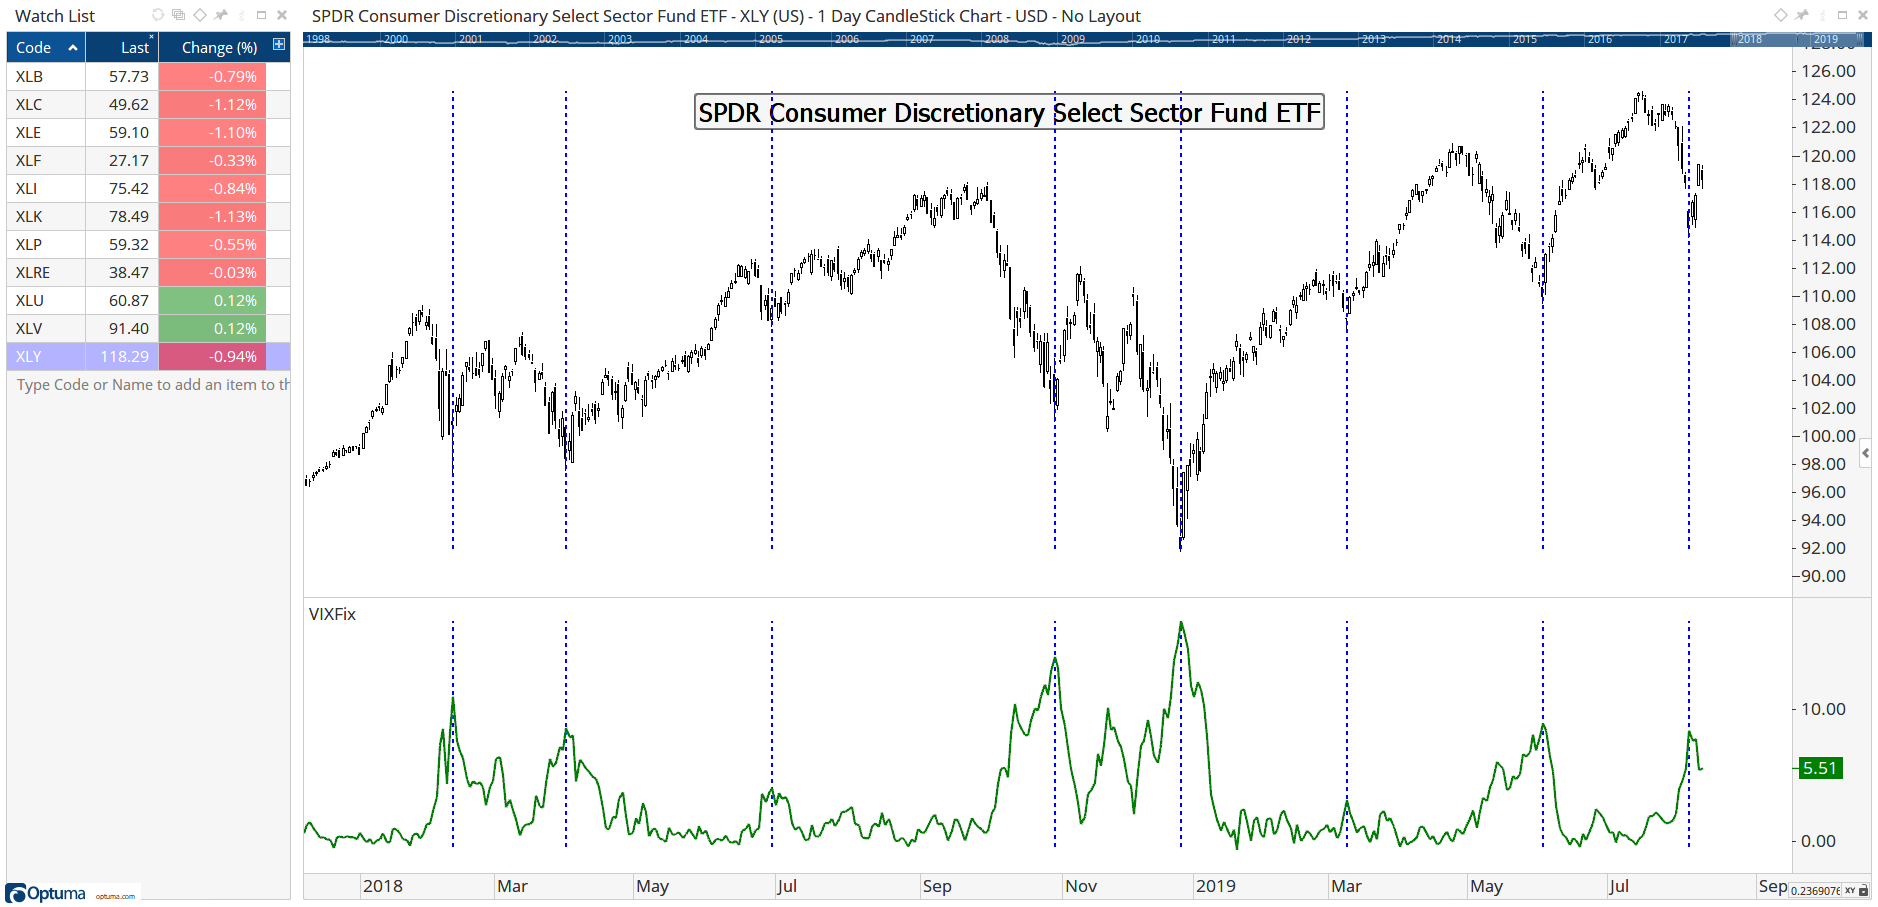
This can then be added to your toolbox (New > Script Tool), making sure that it is applied to a New Tool View – meaning it will be added in a window below the price chart with it’s own scale, much like an RSI or MACD. Once saved, this can then be applied from the right-click menu or custom toolbar button just like any other tool.
September 4, 2018 at 1:02 am #48059Darren
- Topics: 62
- Replies: 521
- Posts: 583
The Williams Accumulation / Distribution formula is:
As a script, we can do this in a Show View:
123456bp1 = HIGH() - OPEN();sp1 = CLOSE() - LOW();hl1 = HIGH() - LOW();(bp1 + sp1) / (2 * hl1)-
This reply was modified 2 years, 4 months ago by
Darren.
August 13, 2019 at 1:53 am #54267Michael
- Topics: 3
- Replies: 7
- Posts: 10
A paper at http://docs.mta.org/dow-award/2015-amber-hestla-barnhart.pdf shows that adding a moving average to the VIXFix can be useful as a timing tool. Of course, adding an MA to an indicator in Optuma is simple to do.
August 13, 2019 at 1:55 am #54269Darren
- Topics: 62
- Replies: 521
- Posts: 583
Thanks Mike. The VIXFix formula above can also be combined with the Pivot() function to highlight significant peaks, which tend to correspond to price lows:
12345678//Get the 22 day highHiClose = HIGHESTHIGH(CLOSE(), BARS=22);//Calculate the VIXFixVF1=((HiClose-LOW()) / HiClose)*100;//Get Pivot highsPIVOT(VF1, TYPE=High, MIN=20)Workbook attached for both US and ASX sector data:
-
This reply was modified 1 year, 5 months ago by
Darren.
Attachments:
You must be logged in to access attached files.
August 19, 2019 at 12:20 pm #54345Jonathan
- Topics: 36
- Replies: 55
- Posts: 91
Maybe I’ve done this wrong…
But applying the VIXFix (Show Bar) to the VixFix goes about highlighting market peaks.
Is this just me being biased to this tool… or is there something here…
Is it just randomly highlighting highs…
I can’t seem to understand the correlation in the calculation.
In theory, for the lagging indicator…. Buy = buy… red = sell
-
This reply was modified 1 year, 5 months ago by
Jonathan.
August 19, 2019 at 12:24 pm #54349Jonathan
- Topics: 36
- Replies: 55
- Posts: 91
You’ve done 22 days, whereas others quote just 20 days,
August 20, 2019 at 1:22 am #54359Darren
- Topics: 62
- Replies: 521
- Posts: 583
Hi Jonathan,
The tool is highlighting the 20 day pivot highs and lows on the VIXFix tool – if you want to make the signals less sensitive increase the pivot MIN=20 values in line 7 of the formula above to make them more significant.
In Larry’s original article he uses 22 days but if you want to use 20 just change the lookback value from 22 in the HighestHigh function in line 3.
1 user thanked author for this post.
August 20, 2019 at 3:11 pm #54363Jonathan
- Topics: 36
- Replies: 55
- Posts: 91
Ahh, Yes makes sense!
Has anyone had any luck using this as a script to pull up potential buys?
August 20, 2019 at 8:49 pm #54365Jonathan
- Topics: 36
- Replies: 55
- Posts: 91
Sorry.
I misunderstood what this indicator did. After testing more… Didn’t realise it was a fully lagging indicator.
-
AuthorPosts
- You must be logged in to reply to this topic.