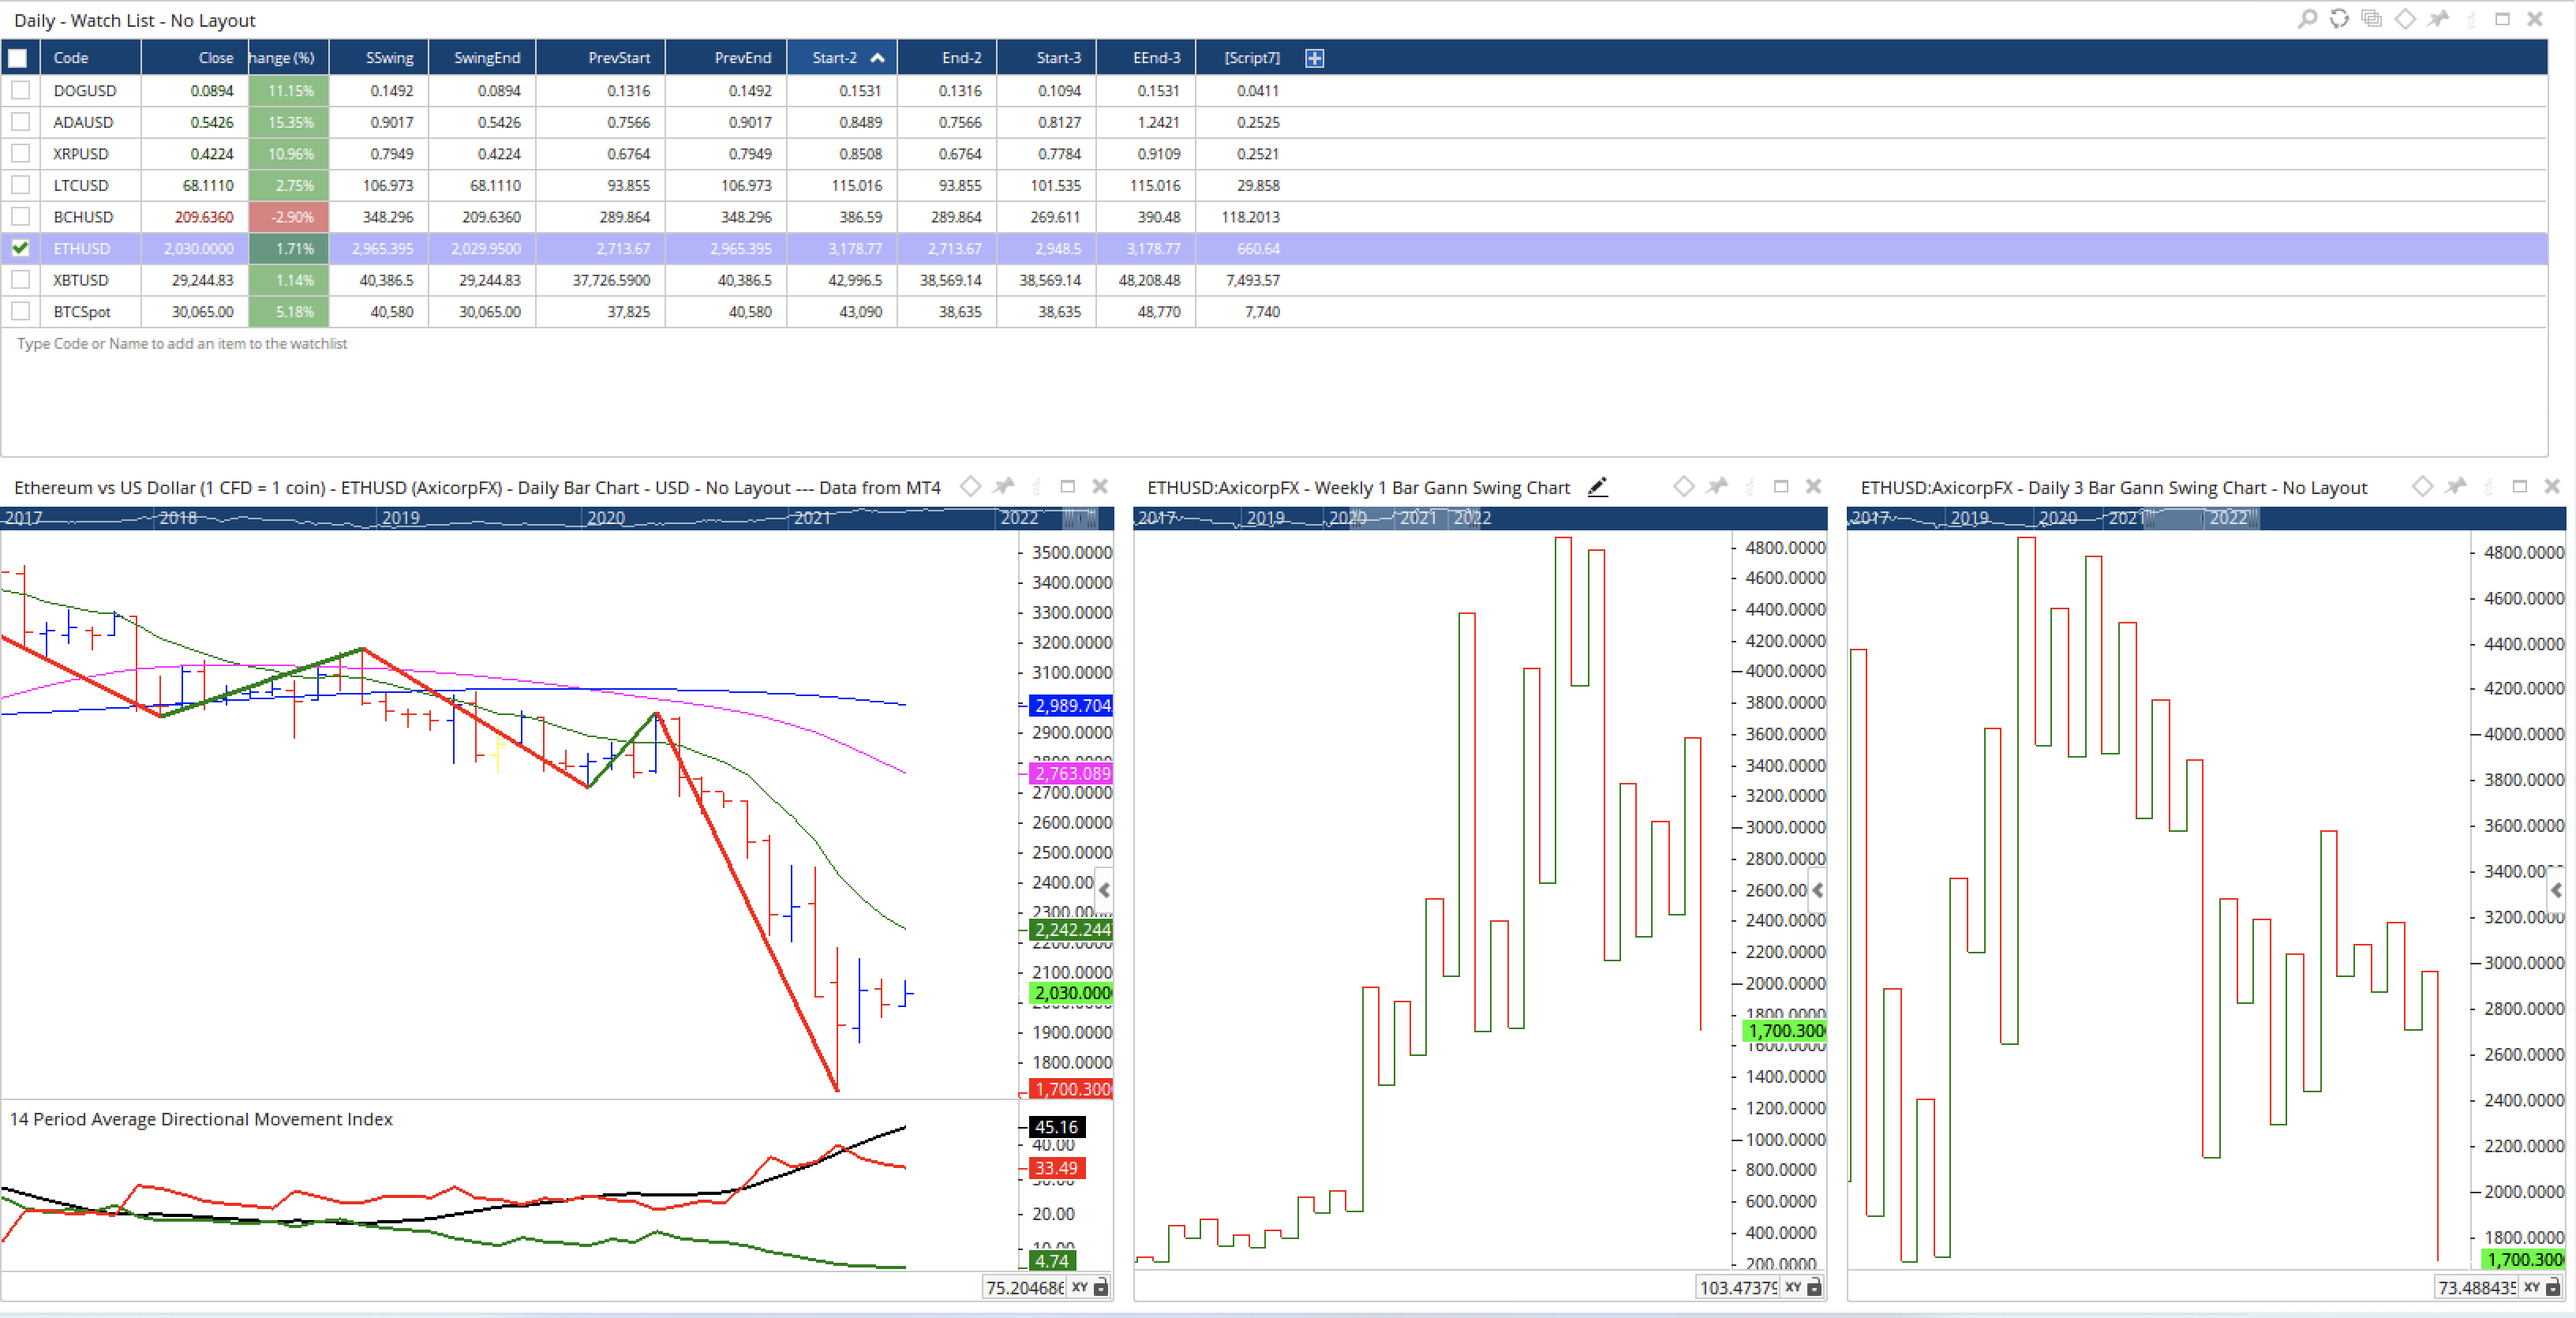
I have been duelling with this issue for over a week following earlier advice. Have attempted to use both SWINGEND and SWINGSTART as well as the dot notation alternate. I am attempting to find for a watchlist the most recent turning point and seem to get the one before as shown in the attached workbook.
The most recent (as shown by the Gann Swing Overlay 3 Day) and confirmed as confirmed in the spreadsheet extracts (attached) does not seem to be revealed in the script for the watch list? The workbook shows the start and end and a couple of offsets for each but when I check values for EthUSD not the 1700.36. (I have the same issue with other items).
Once I validated these I was planning to put Volume for each swing and the volume since the last swing into the watchlist of “entry” criteria.I was thinking that I needed to use the bar list as opposed to the swing list for this. As attempts to date with ACCSINCESIGNAL have seemed to fail. The signal is the turning point and the duration (lookback) the number of bars which I calculated by SWINGSTART - SWINGEND ; Does this return bars or price difference?
The workbook you uploaded does not seem to have any Watchlist or tools applied as per your screenshot, it is just a blank chart of ETHUSD, so I can’t confirm what scripts you are using at the moment.
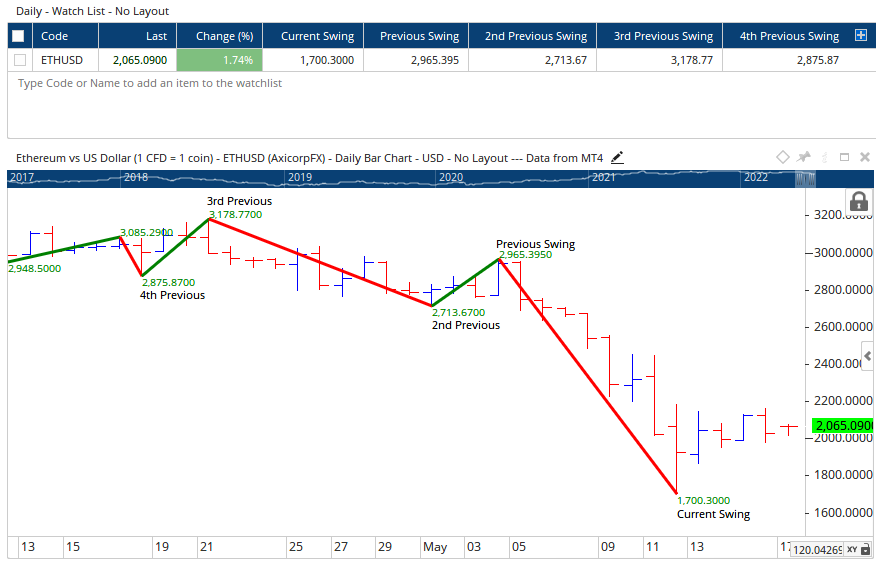
To identify the current swing (1700.3 in this instance) no offsets or dot notations are needed.
V1 = GANNSWING(SWINGCOUNT=3);
V1
The above script would return the value of 1700.3 for ETHUSD, which is what i think you are looking for?
I’ve attached a workbook with the current swing, and swing offsets included in the Watchlist, with the corresponding swing marked on the chart for your reference.
The volume between each swing can be tricky, you need to work out if you are wanting to mark the volume from the bar the swing actually turns (confirmed) or just a straight count between Swing Start to Swing End. The functions to do this will change depending on the answer to that question.
I have made progress with this challenge thanks to your help. However the script below if I just use the first 4 lines in a show view seems to show peaks offset from the swing start and swinging; I assume this is the confirmed turns. What I want to use for this task is simply the swing start and swinging values. You expected this issue and state that there are different functions that I should use.
I have experimented by setting
1 ss = SWINGSTART();
2 se = SWINGEND();
3. d1 = ss - se;
4. V1 = ACCSINCESIGNAL(ss,d1)
However it appears not to accept the d1 = ss -se. I am assuming this is due to ss, se values being the wrong datatype. Is this correct and can I use dot notation to specify date etc?
Further to my last reply, measuring the Volume between Swing Start and End, without taking the confirmation date into consideration is quite tricky. We go to a lot of trouble to try and make sure the Confirmation date of a swing turn is always taken into account with scripting, as it is essential for the backtesting of any swing scripts to return relevant results.
Below is a script you can use to add up the volume between Swing Tops and Bottoms, without taking confirmation dates into consideration.
//Set Swing Stats
V1 = GANNSWING(SWINGCOUNT=3) ;
ss = SWINGSTART(V1);
se = SWINGEND(V1);
d1 = ss-se;
//Find swing peaks / troughs
d2 = d1 > d1[1];
d3 = d1 < d1[1];
d4 = SWITCH(d2,d3);
//Find Up Swing Vol and Accumulate
d5 = IF(D4==1,VOL(),0);
d6 = ACCSINCESIGNAL(d5,d4==1);
//Find Down Swing Vol and Accumulate
d7 = IF(D4==0,VOL(),0) ;
d8 = ACCSINCESIGNAL(d7,d4==0) ;
//Show Both Up and Down Swing Cumulative Values
IF(d4==1,d6,d8)
I am not sure if this will just be used on charts, but please note this script can’t be used on the Back Tester or Scanning Manager.
I have been testing the script and tweaks of it on a number of stocks; I start by using the script as a show view and note that it drops to zero one bar after the turning point which is great. I then added a view using the VOL() tool, and also added the script to the watchlist. What happens is that the total volumes are different. I assume this is due to the way VOL() is calculated. Can you confirm this please.
I also exported the Volume view data into a spreadsheet and added according to the turning points as shown in the show view created from the script above. But again I get different numbers. Tried offet by one and looking to see if I can get alignment using just my eye but to no avail.
So I am missing something; please help educate me on validation of this thanks.
Using the original script from my last reply, I’ve marked the Cumulative Volume totals and the range they are being calculated from for your reference:
Each bars volume is only being counted once, and resets at the start of the next swing. Based on this, the results appear to be as expected.