Testing the weekends blog script but finding it’s giving results outside of the script criteria. When testing on ASX 200, many stocks that are not new 52 week highs or lows are appearing. Can you tell where my problem lies. Scan produced 76 results. Or have I miss understood the script?
One thing to note is that the script is using the Close() as the data element. That means that it is looking for today’s Close to be the highest one compared to all the closes over the last year. So if you look at the results that you have, is it possible that the close is the highest/lowest?
One way to easily check is to add a 1 period moving average set to Close. That will give you a line that you make thick so you can see.
If you want highs and lows instead, you could use this script
Thanks, but still not producing correct results. Using either script a2m and abc are the first two codes in the search. Neither is making a new 52 week high or low or 52 week closing high or closing low.
As for your issue, did you type the text of the script or use the pop-up windows to build it? The reason I ask is that the syntax is incorrect with missing commas, resulting in the error (the scan is using the 8 period highs/lows defaults).
If we don’t provide the script to copy it’s always best practice to use the script editor pop-ups to build the formula by clicking on the text and choosing the parameters from the window. In your example, after typing HIGHESTHIGH() click on it to change the parameters to automatically add the text with correct syntax:
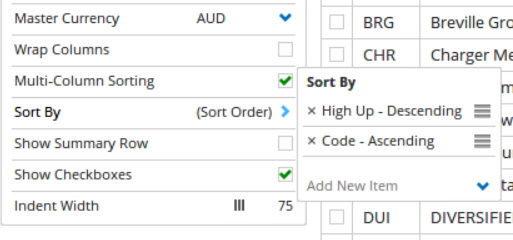
The only way to group watchlists automatically is with a Professional Services subscription which allows for more advanced features, such as grouping by ‘sign’ ie positive and negative values. Once grouped you can then sort by Code. Please contact support for subscription upgrade options.
Multi-sorting only works when one of the columns has the same values for multiple symbols, and the second column is then used to sort within the first column. As the Code and Change % columns are both unique, multi-sort wouldn’t be applicable.
Here’s an example with the list sorted by Sector Name first, then by descending Change %:
That’s what multi-sort does, but because the change is very likely to be different for each symbol so it would sort on that first. The first column being sorted has to have the same value, as in the Sector Name above.
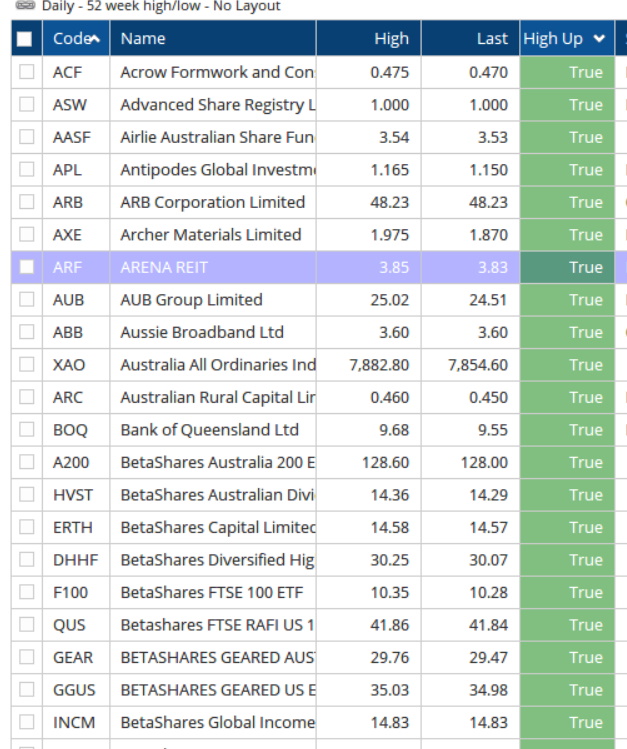
The only thing I can think of is to add a true/false column (eg CLOSE() IsUp) and sort on that and then the code.
That didn’t really work as the Close could be down on day where a new high is made.
I tried to use HIGH()>HIGH(OFFSET=-1) to test that today’s high is greater than yesterday’s high but that does not seem to give the expected answers. Am I using the Offset parameter correctly?
OK, I cracked it. ‘High() IsUp’ works but, of course, an outside bar on a stock making a new low returns true which is not what I wanted.
The high-low scan is as per published scripts. The script column uses ‘HIGH() > HIGHESTHIGH(BARS=52,BACKTYPE=Weeks)’ to obtain a true/false result. I can then sort on the script column and then Code.