The results for the low you are seeing are from the first match found within the 52 week range. The result you are after is from the most recent bar, the way to do this in a Watchlist is to use a script like this (i’ve included notes on what each step does):
//Go Back 52 Weeks to trigger signal start
start = BARDATE() == LAST(BARDATE()) - (52*7);
//Find where signal matches the Lowest Low Value
sig = Low() == LOWESTSINCE(start);
//Remove Non Zero results showing most recent result as latest value
date = BarDate(nonzero(sig));
date
This should return the results you’re expecting to see in the WL column.
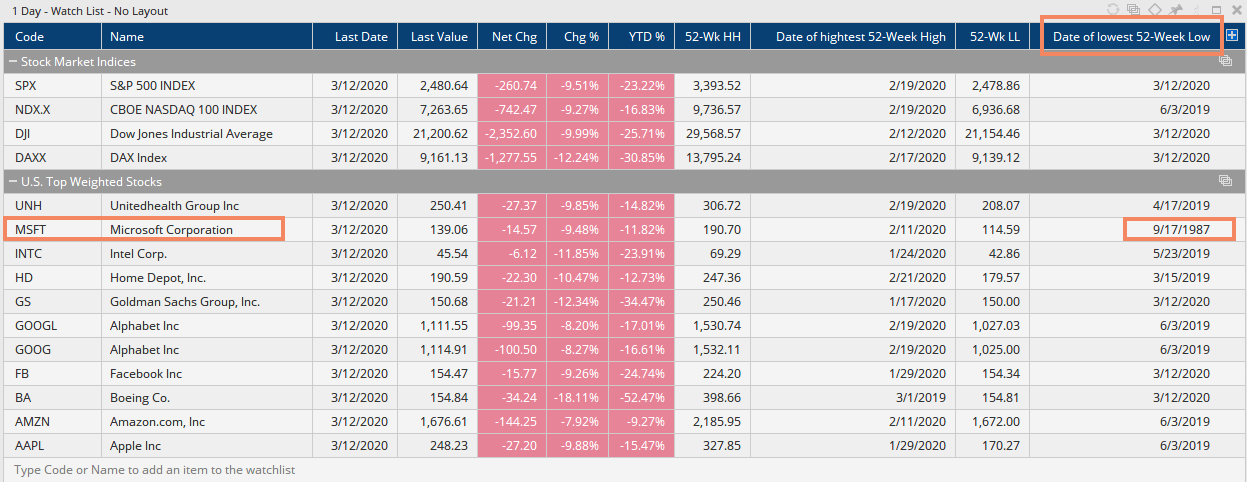
thank you for your script. In my watch list it works almost perfect but unfortunately not for Microsoft. The watch list shows the date 9/17/1987, that date is the first day data are available.
We think it’s the LowestSince() function that’s causing this outlier issue, we’re looking into it further. For now the following adjusted script seems to be working without producing the outliers:
In our fundamental data we now have have dates for high and low prices over the week, month, quarter, 6 months, year, and all-time. These can be added as a watchlist column from the Fundamental Field list without having to create a formula:
However, this will only work for equities and ETFs as fundamental data isn’t available for indices, forex, cryptos, etc. I’ve come up with an alternative using BARINDEX() instead of BARDATE() to avoid weekends and holidays:
52 week low date:
//Define lookback eg 252 trading days for a year;
Start = (BARINDEX() == LAST(BARINDEX() - 252));
//Find when the low matches the lowest low value over that period;
Sig = LOW() == LOWESTSINCE(Start);
//Remove Zero results showing most recent result as latest value, and display as bardate;
BarDate(NonZero(Sig))
52 week lowest close date:
//Define lookback eg 252 trading days for a year;
Start = (BARINDEX() == LAST(BARINDEX() - 252));
C1 = CLOSE();
//Find when the close matches the lowest close value over that period;
Sig = C1 == LOWESTSINCE(C1,Start);
//Remove Zero results showing most recent result as latest value, and display as bardate;
BarDate(NonZero(Sig))
In this example, the 52 week low for Home Depot was on June 22nd ($264.51), but the lowest close ($266.58) occurred on September 26th:
For those interested in this topic here is a summary of the scripts:
52-Week Highest High
HIGHESTHIGH(BACKTYPE=Weeks, BARS=52, INCBAR=True)
52-Week Highest Close Date
// Define Lookback eg 252 Trading Days for a Year
Line1 = (BARINDEX() == LAST(BARINDEX() - 252)) ;
Line2 = CLOSE() ;

// Find when the Close Matches the Highest Close Value over that Period
Line3 = Line2 == HIGHESTSINCE(Line2, Line1);

// Remove Zero Results Showing Most Recent Result as Latest vValue, and Display as Bardate
Line4 = BarDate(NonZero(Line3)) ;
Line4
52-Week Highest High Date
// Define Lookback eg 252 Trading Days for a Year
Line1 = (BARINDEX() == LAST(BARINDEX() - 252)) ;

// Find when the High Matches the Highest High Value over that Period
Line2 = HIGH() == HIGHESTSINCE(Line1) ;

// Remove Zero Results Showing Most Recent Result as Latest Value, and Display as Bardate
Line3 = BarDate(NonZero(Line2)) ;
Line3
52-Week Lowest Low
LOWESTLOW(BACKTYPE=Weeks, BARS=52, INCBAR=True)
52-Week Lowest Close Date
// Define Lookback eg 252 Trading Days for a Year
Line1 = (BARINDEX() == LAST(BARINDEX() - 252)) ;
Line2 = CLOSE() ;

// Find when the close matches the lowest close value over that period
Line3 = Line2 == LOWESTSINCE(Line2, Line1);

// Remove Zero Results Showing Most Recent Result as Latest Value, and Display as Bardate
Line4 = BarDate(NonZero(Line3)) ;
Line4
52-Week Lowest Low Date
// Define Lookback eg 252 Trading Days for a Year
Line1 = (BARINDEX() == LAST(BARINDEX() - 252)) ;

// Find when the Low Matches the Lowest Low Value over that Period
Line2 = LOW() == LOWESTSINCE(Line1) ;

// Remove Zero Results Showing Most Recent Result as Latest Value, and Display as Bardate
Line3 = BarDate(NonZero(Line2)) ;
Line3