A simple way would be to take the difference in price over a set number of bars and then divide that by the bars.
eg
v1 = MA(Bars=10);
(v1 -v1[10]) / 10
But essentially that is the same as the Momentum tool, so you can use that instead.
v1 = MA(BARS=10);
MOMENTUM(v1)
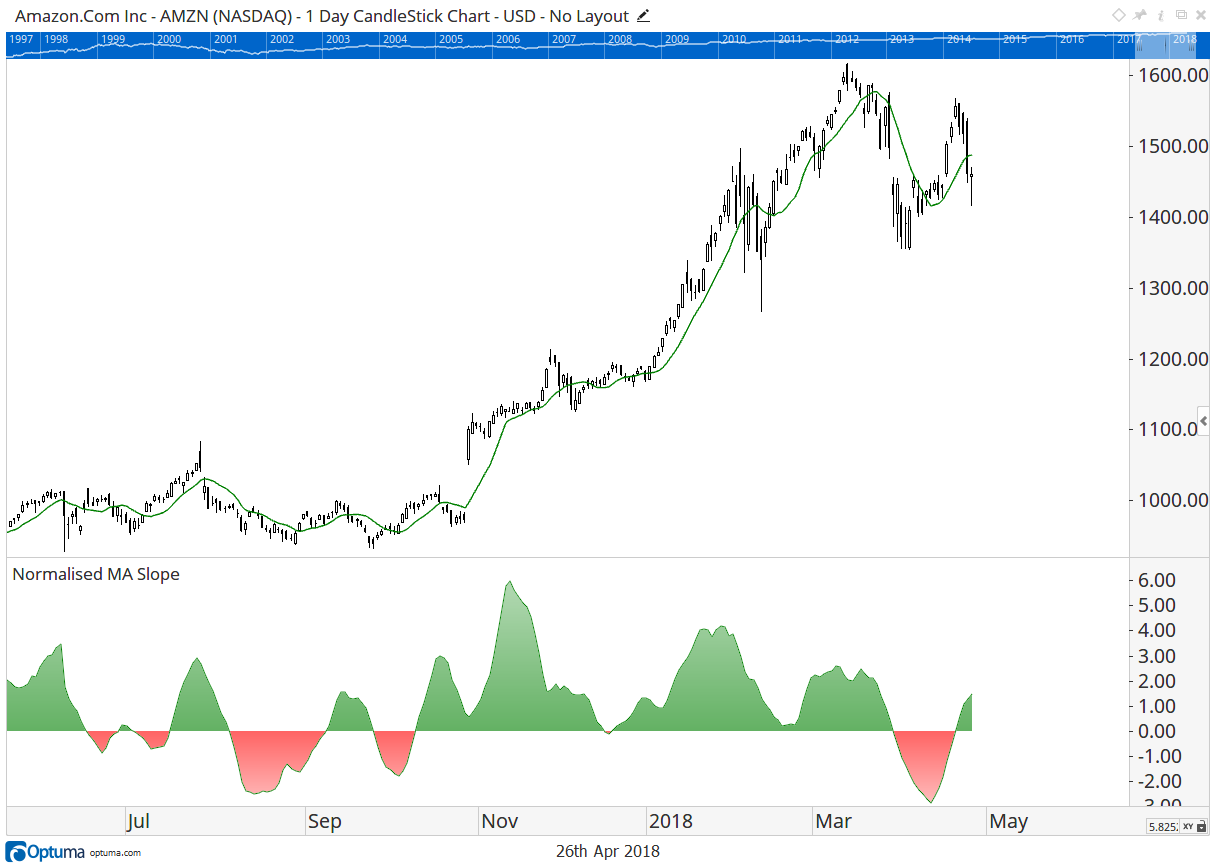
This is a ratio and not an angle, but the concern I have is that when we put TA values into a watchlist, we do that because we want to compare and rank them. The issue is that the “slope” is different for each security that we are looking at, so a 50c/day slope on a $1 security is very different when it happens on a $100 security.
The only way that you could do that is to “normalise” price first. I like using ATRs for that as I can then normalise using the volatility of the security.
eg
v1 = MA(BARS=10);
v2 = ATR();
MOMENTUM(v1)/v2
With this, you will have a slope for the MA that is able to be compared between different securities.