macd buys and sells

Hey all,

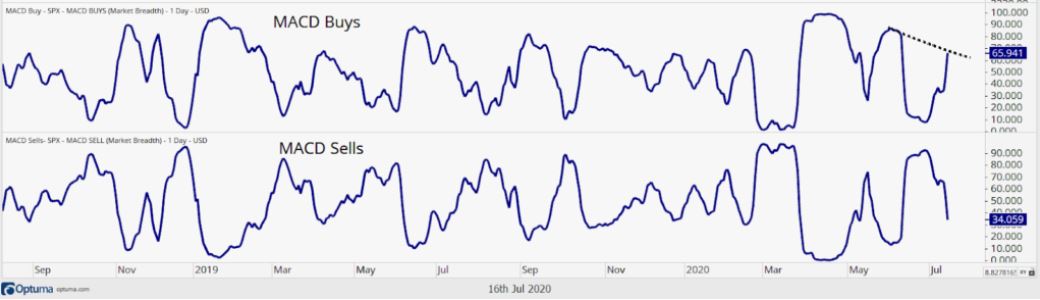
I’m new to scripting and am in search of a little guidance. Looking for a way to calculate and then graph the percentage of stocks that are on macd buy signals and macd sell signals in a given index… say the S&P 500. Found the picture online…

Any assistance appreciated!

Hi Joshua,

You can recreate this one by building a Percent Breadth measure on the S&P500 using the following scripts:

Buy

MD1 = MACD(TYPE=COMBO, BAR1=12, BAR2=26, OSC=9);
MD1.OSCILLATOR > MD1.AVERAGE

Sell

MD1 = MACD(TYPE=COMBO, BAR1=12, BAR2=26, OSC=9);
MD1.OSCILLATOR < MD1.AVERAGE

Best Regards,

Reuben

Hi Reuben,

Thank you for the information. Is there a way to tally these up for an index like the S&P 500 or NASDAQ 100?

You should be able to set the Codes to Include to be the S&P 500 or the NASDAQ 100 from the Lists section in the security selector. You can then set the Breadth Action to Percent, which is what was in the images you sent, or you can change it to Count if you want the actual numbers.

Breadth Actions

Hope this helps,

Reuben