The Mansfield Relative Strength indicator comes from Stan Weinstein’s book ‘Secrets For Profiting in Bull and Bear Markets.’ It takes the relative price of a stock against a benchmark, and compares it to the 200 day moving average.
Here’s the formula in Optuma using the RIC() function, which can be used in a Show View and saved as an indicator:
// Set Lookback period;
#$LB=200;
//Calc Relative Price vs SPX;
RP = RIC(DATESEL=None, ZEROBASED=True, INDEX=SPX:WI);
//Calc SMA of RP;
SMA = MA(RP, BARS=$LB, CALC=Close);
//Calc Mansfield RS;
MRS = ((RP / SMA)-1)*100;
MRS
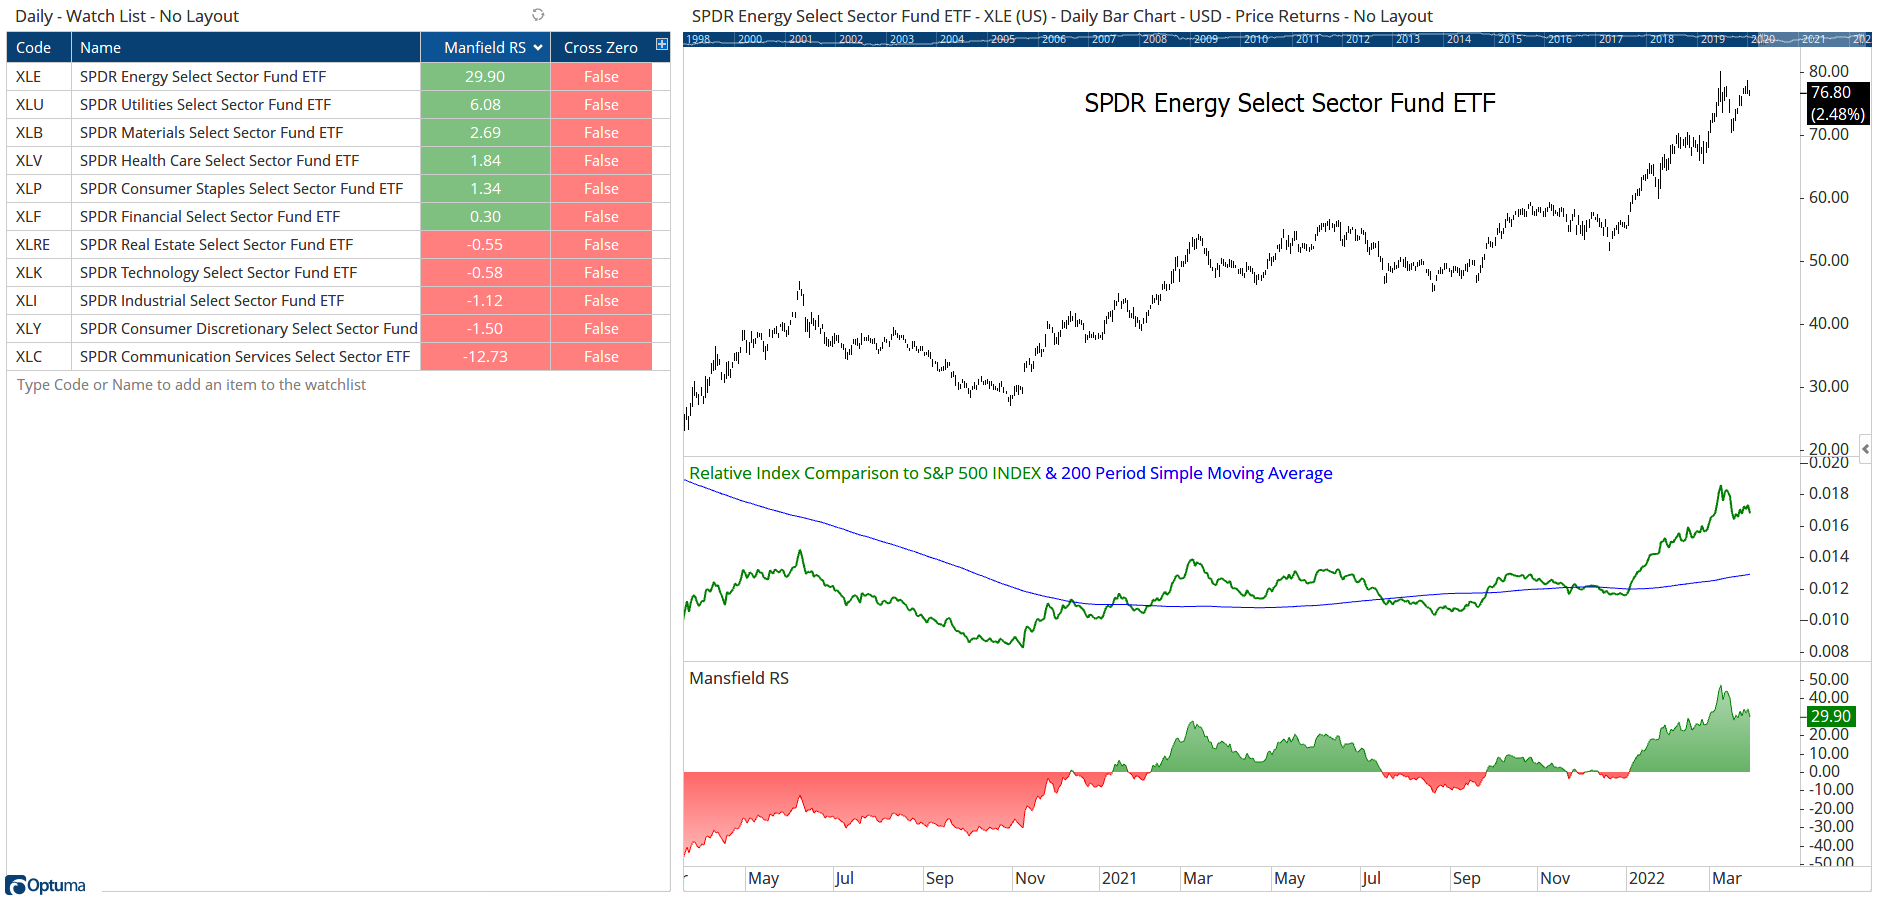
Here’s the Mansfield RS displayed at the bottom of the chart of $XLE, showing green when the relative price is above its 200MA and red when below:
Scans / tests could be set up for when the indicator crosses above or below zero by changing the last line of the script as follows:
MRS Crosses 0
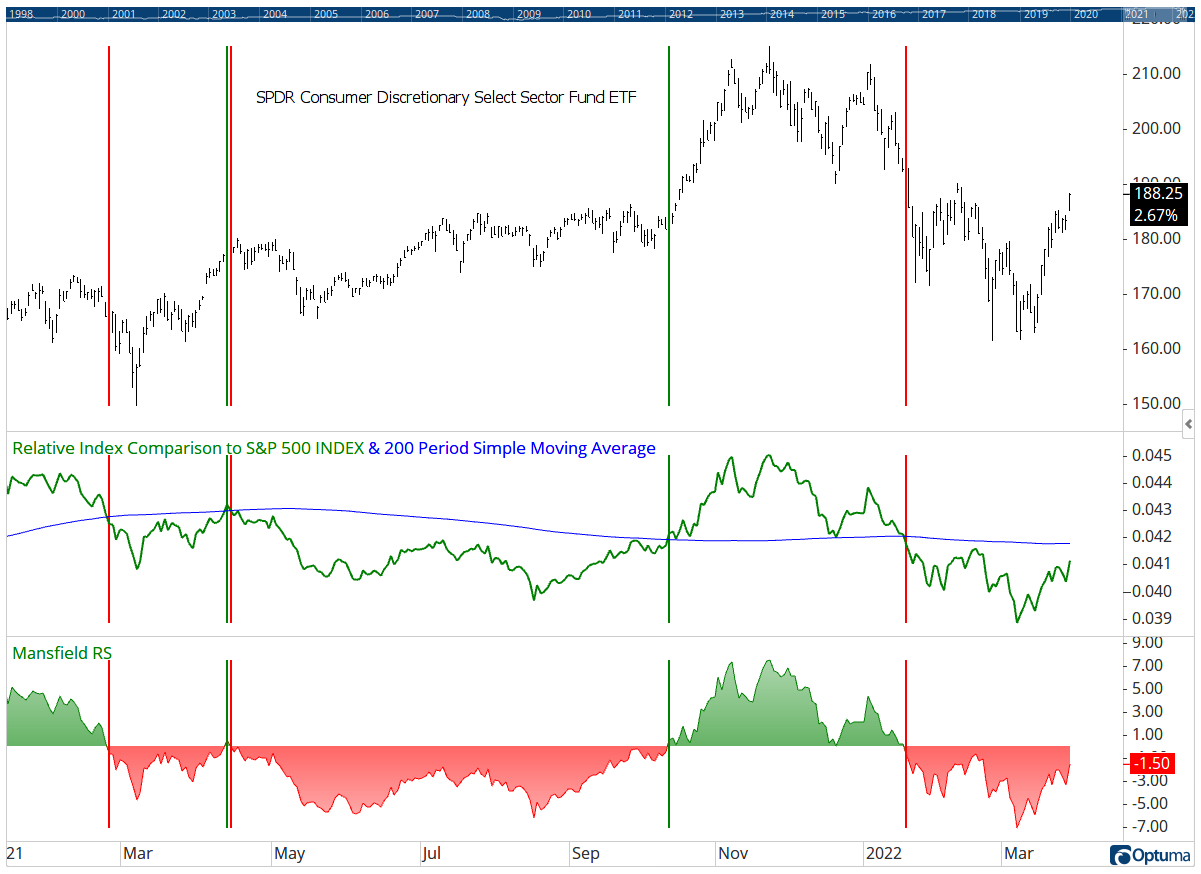
The signals can then be placed on a chart using the formula in a Show Bar:
Clients can save and open the attached workbook in their copy of Optuma for examples.
Mansfield-RS.owb (85.6 KB)