Hi,
I’d like to request the ability to adjust the amplitude of the historical market curve/line for the chart overlay tool. It would be great to be able to click on the historical curve/line and adjust the amplitude independently of the current market.
At the moment I can adjust the current market chart by clicking on the vertical scale and scrolling my mouse to increase its amplitude to match that of the historical market curve, but not the other way around. It becomes a problem if I am trying to compare several overlays at once i.e. I can only currently match the amplitude of the current market to match 1 overlay.
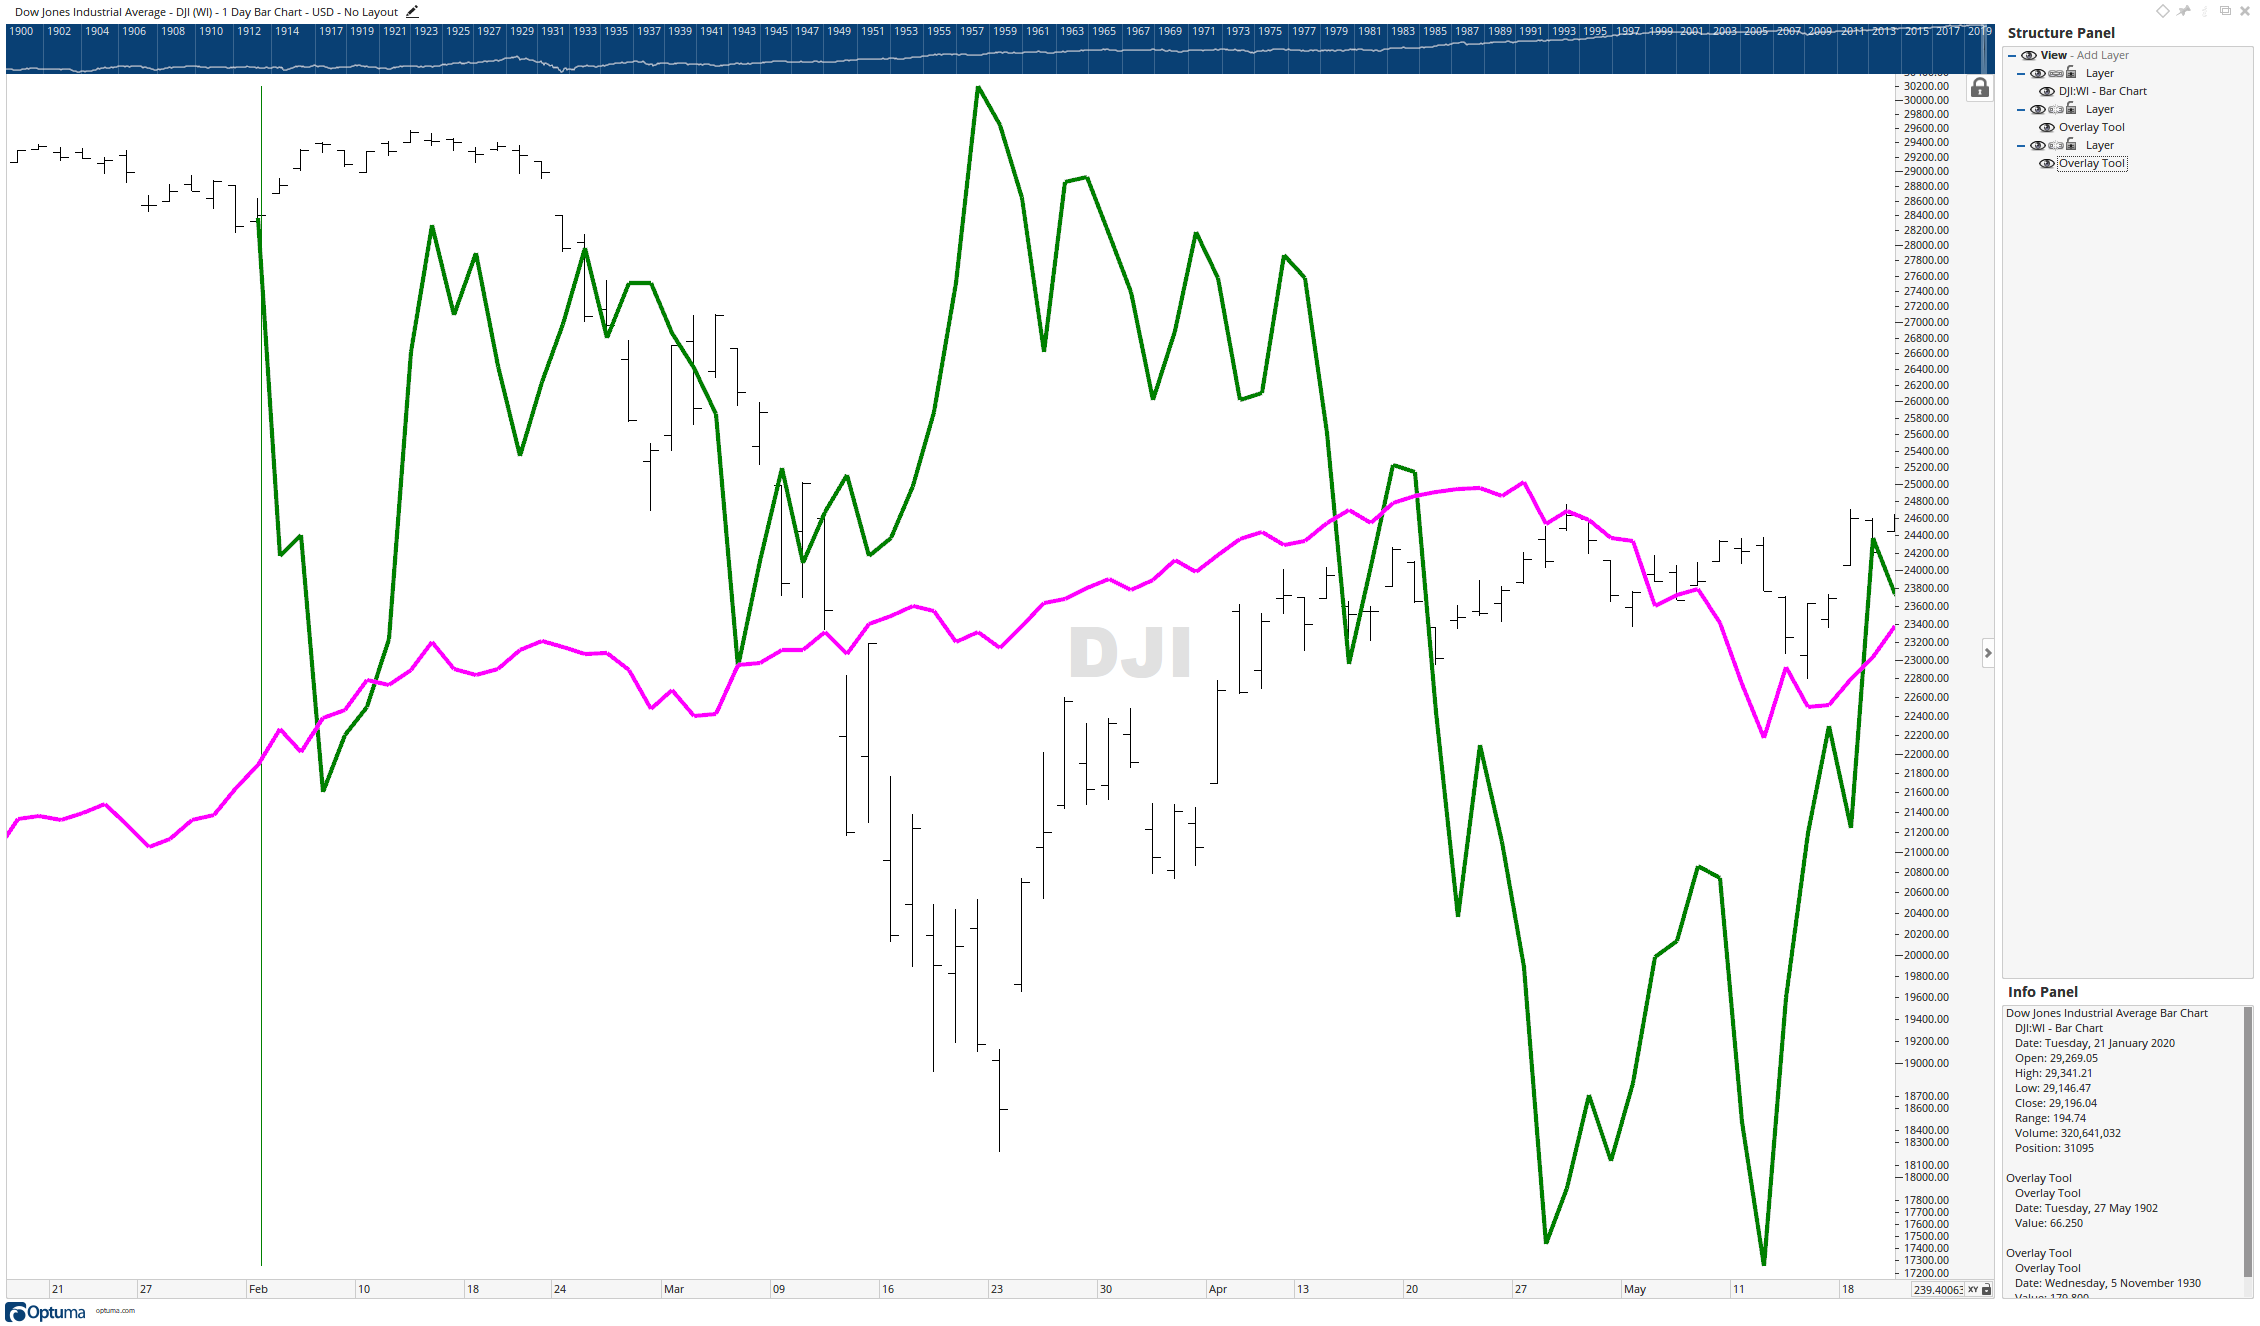
You can see in the screenshot attached that there is a need to adjust the amplitude for the pink overlay line to better match that of the current market (black) and the second overlay line in green. I have tried using logarithmic scale to overcome this, but it has limitations.
Chris