Does Optuma have the Moving Linear Regression line?
if not, is there something similar?
Thanks
Does Optuma have the Moving Linear Regression line?
if not, is there something similar?
Thanks
Hi Raul,
We have the Trailing Linear Regression tool which draws the regression line over the last X bars on a chart:
We also have the Linear Regression Slope tool that calculates the slope of the line, so when it’s above zero the slope if positive:
If these are not what you require please provide a screenshot of what you are looking for.
Also, don’t forget that you can search for our tools either in the Tools menu of the software, or our online KnowledgeBase.
Thanks for your quick response, Darren.
I have checked the “Trailing Linear Regression” and the “Linear Regression Slope” indicators but is not the same.
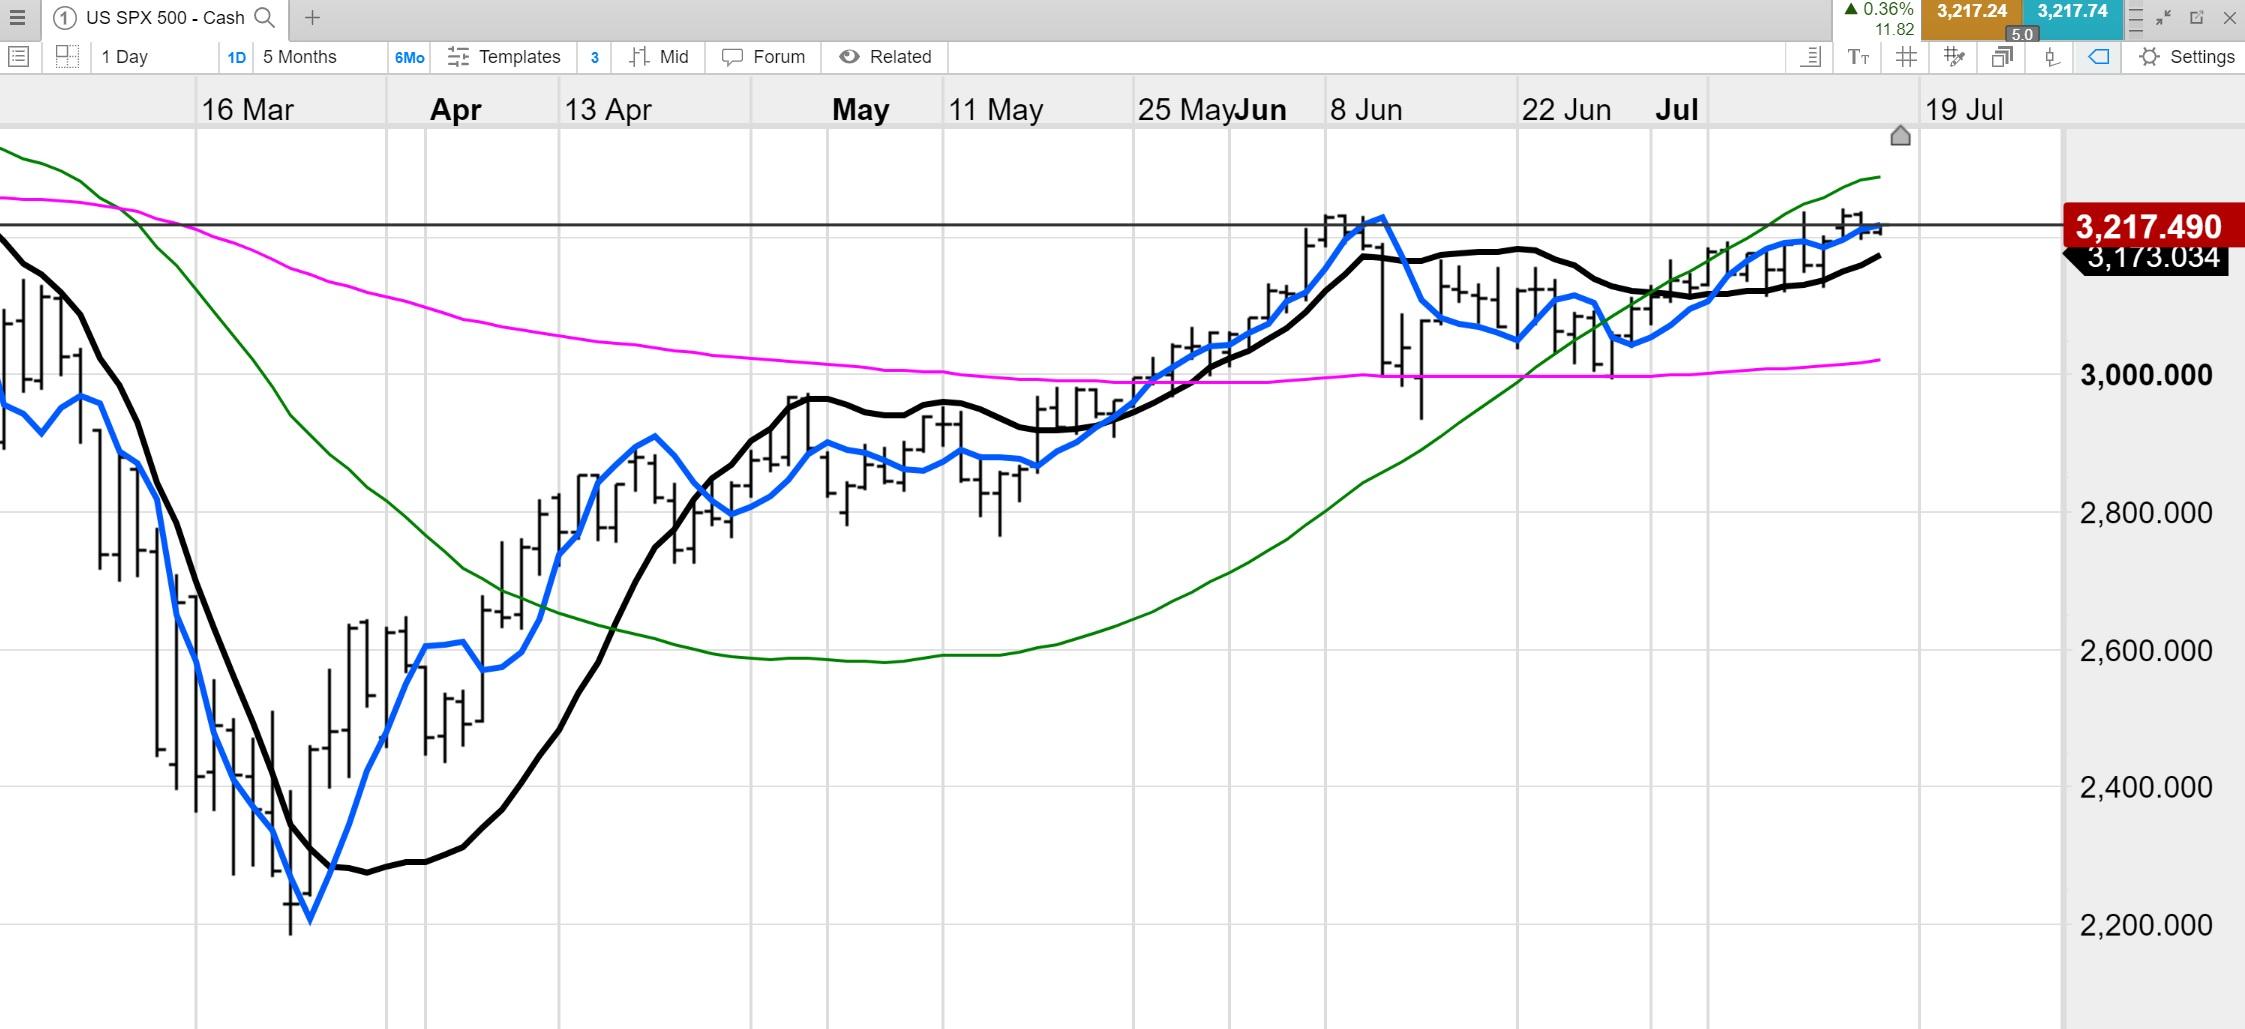
The Moving Linear Regression is a moving average substitute. Please see image below
Pink line 270 period, Green line 90 period, Black line 30 period, Blue line 10 period.
Is it possible to convert the Linear Regression tool into a moving average with a script?
Thanks for your help.
Hi Raul,
We also have the Linear Regression Intercept tool:
Not sure if you got this sorted Raul, but I managed to put this together to get a Moving Linear Regression
For a 30 period use this in a SHOWPLOT:
var1 = LRSLOPE(BARS=30);
var2 = LRINT(BARS=30);

var1*30+var2
Change out the 30’s for 10, 90, 270 etc