Hi,
Here is the script:
//Count of all bars minus 1;
$Bars = BARCOUNT(Month(PERIODAMOUNT = 1)) -1;
//Std Dev of CAPE Detrended
Var1 = (STD(BARS=$Bars));
Plot1 = Var1;
Plot2 = Var1 * 2;
Plot3 = Var1 * 3;
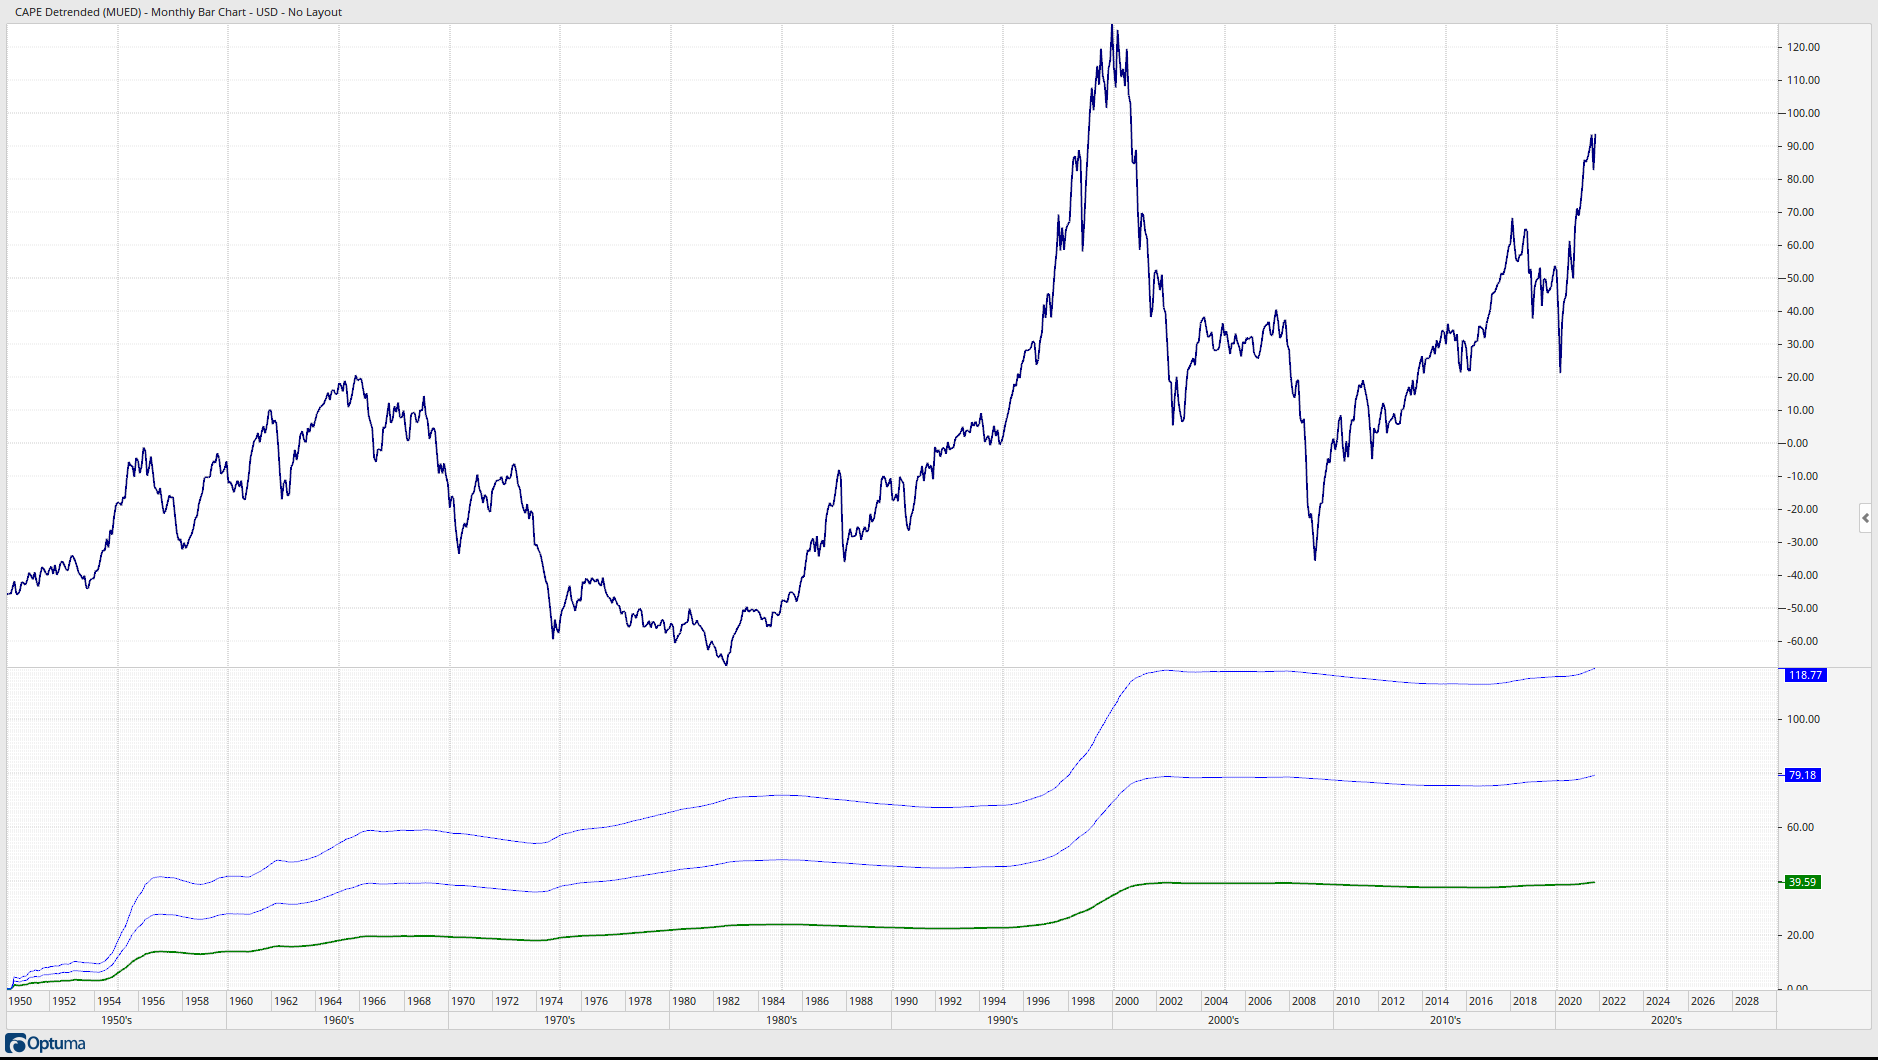
This script works as it should, here is the screenshot:
Now I have changed the plot output to the last value using the LAST() function:
Here is the script:
//Count of all bars minus 1;
$Bars = BARCOUNT(Month(PERIODAMOUNT = 1)) -1;
//Std Dev of CAPE Detrended
Var1 = (STD(BARS=$Bars));
Plot1 = LAST(Var1);
Plot2 = LAST(Var1 * 2);
Plot3 = LAST(Var1 * 3);
This script give some strange results, see the screenshot:
What did I made wrong?
Thanks and best wishes,
Bearski79
9 November 2021 08:26
2
Hi,
Try the following alternate script:
//Count of all bars minus 1;
$Bars = BARCOUNT(Month(PERIODAMOUNT = 1)) -1;
//Std Dev of CAPE Detrended
Var1 = (STD(BARS=$Bars));
V2 = LAST(Var1) ;
Plot1 = V2 ;
Plot2 = V2 * 2 ;
Plot3 = V2 * 3;
Hi Matthew,
thanks for the script, it works. A really cool change.
Thomas
Hi Matthew,
sorry but I am here again. I have some issues with the formatting of the three lines.
Here is a loom video link:https://www.loom.com/share/40b6312a9603404cbfc7f0b6a05d9f9c
As you can see I can change the setting of the lines but when I switch to another chart and than switch back to my “CAPE Detrended” chart all settings are gone.
What can I do so that all settings are permanent WITHOUT scripting the formatting settings? If the formatting can only be done permanently with scripting, what are the scripts.
Thanks,
Bearski79
9 November 2021 09:34
5
Hi,
Yes, you need to setup the lines in the script directly to keep them retained.
You can see examples here of how to do it:
https://help.optuma.com/kb/faq.php?id=722
type plot1. and you’ll see a list of available options you can select.