Hi,
One short question: “Is in Optuma the Excel function “NORMSDIST” available?”
For example: NORMSDIST(-0.5333-(0.633*A1)).
The values -0.5333 and -0.633 are constants.
Thanks,
Thomas
Hi,
One short question: “Is in Optuma the Excel function “NORMSDIST” available?”
For example: NORMSDIST(-0.5333-(0.633*A1)).
The values -0.5333 and -0.633 are constants.
Thanks,
Thomas
Hi Thomas,
No, we don’t have that. I’m curious as to how you would use that in Optuma. Do you see it having value as a time series data set?
All the best
Mathew
Hi Mathew,
thanks for your replay. The reason why I am interested in this function is an article from the Fed of New York about how to calculate the probability of a recession. See page three in “The Yield Curve as a Leading Indicator: Some Practical Issues”.
Here are the links:
…The Yield Curve as a Leading Indicator - FEDERAL RESERVE BANK of NEW YORK
…The Yield Curve as a Leading Indicator: Some Practical Issues - FEDERAL RESERVE BANK of NEW YORK
At the moment I make the calculations in Excel and create a csv file to display the data in Optuma. I have no problem with that but thought perhaps it is possible to do the calculations directly in Optuma.
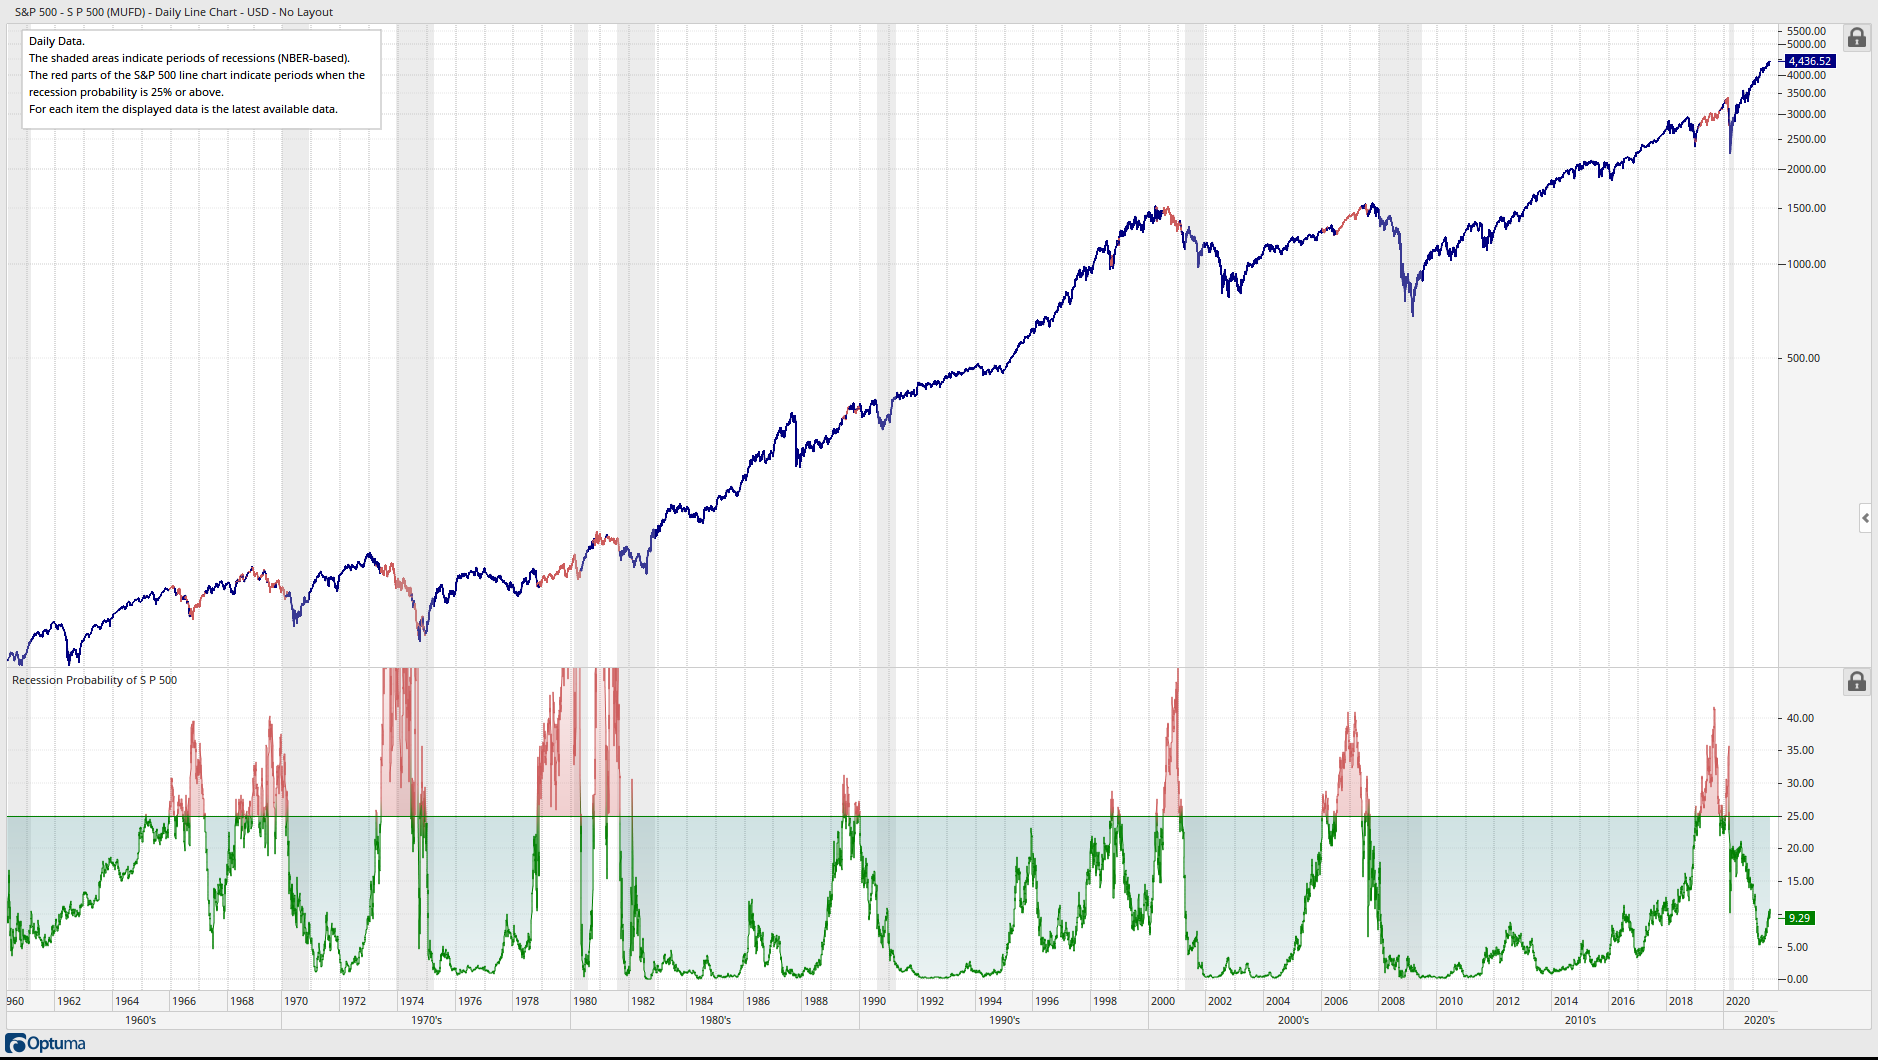
Here is a chart about how I use the recession probability:
Best wishes,
Thomas
The-Yield-Curve-as-a-Leading-Indicator-Some-Practical-Issues.pdf (403 KB)
Probability-of-U.S.-Recession-Charts.pdf (34.7 KB)
Hi Thomas,
I’ll have a read and see what we can do for Optuma 2.1.
In the mean time have you seen this https://twitter.com/mathewverdouw/status/1322400468530683906
All the best
Mathew
Hi Thomas,
I’m reviewing my notes and I had a link to this post to come back to.
Given this function, we have one value for each value of X
function NormDist(X, Mean, StandardDev : Single; Cumulative : Boolean) : Single;
The intention is to add this as a scripting function (not an indicator added to a chart).
Does that meet what you were looking for?
Further to this, how are the values Mean and StdDev in the NormDist function calculated?
I see in your Excel that they are constants but how were they generated? No need to answer if that is a proprietary process.