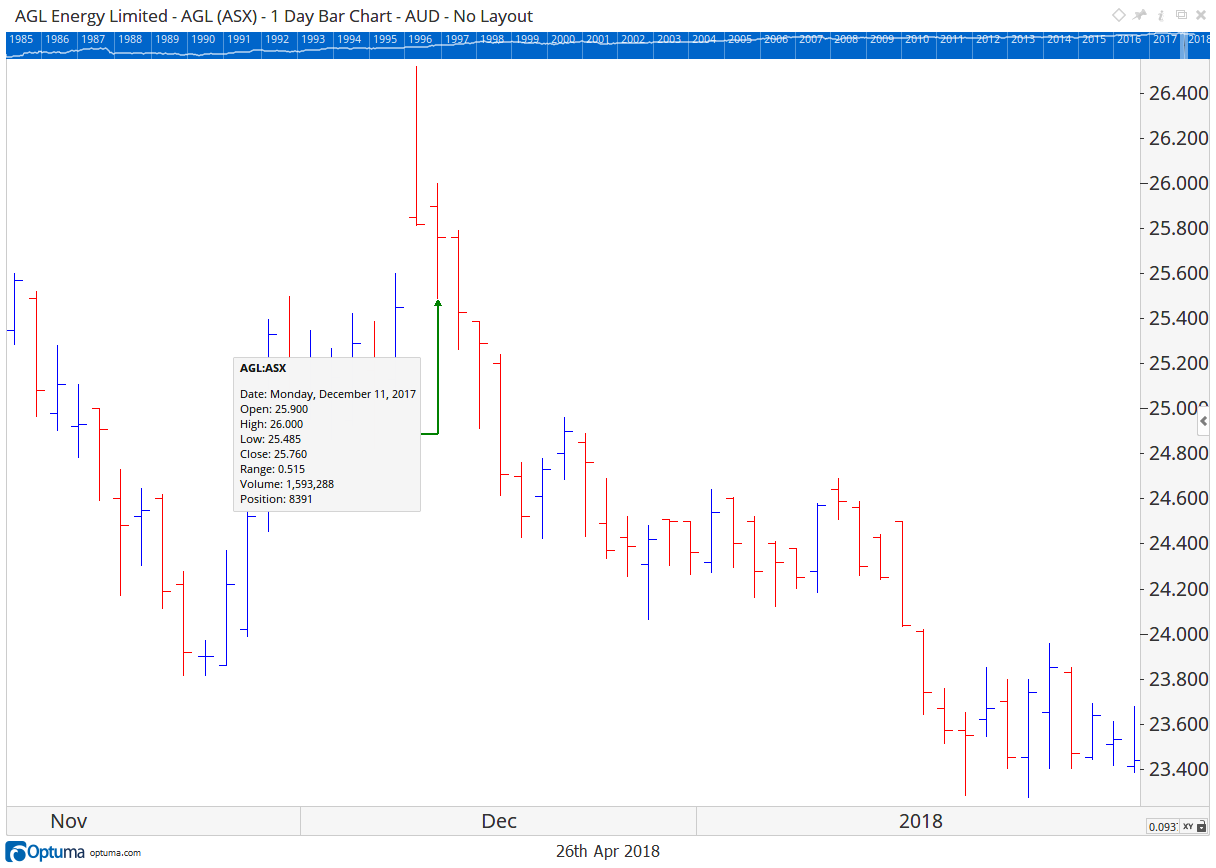
I'm wondering if someone can advise me if I need to be worried about apparently large numerical errors when I replicate a script in excel, where hand computation confirms Excel as accurate and Optuma as not accurate. Attached is the computation in excel and in optuma based on 1 daily bar, 11 dec 2017 for stock code AGL.
Is this error because the numbers (High, Low, Open, Close) displayed by Optuma on the chart are rough? How can such a simple computation result in a 20% error in 1 step?
If I have a BUY threshold on a number with 20% error (or worse, or a bunch of summed numbers, each with 20% error), then I'm buying wrongly in a random way because of cumulative internal truncation/rounding errors of some kind.
I tried playing with the 'format' and 'decimal type' fields in the script editor ... with no observable effect.
I feel I must have missed something. Please advise.
cheers
colin hales
26Apr_Book1.xlsx (10.6 KB)