Hi,
I have a question concerning a script for coloring bars according to values of the “Ratio Line” of the Optex Bands indicator.
What I want is a script that colors the bars of e.g. the S&P 500 in green when the “Ratio Line” of the Optex Bands indicator is less than -1.
e.g. Ratio Line Optex Bands<=-1
I know how the settings have do be made in the “Properties” panel of the chart for coloring the bars. I only need the script.
Many thanks for your help.
Thomas
DEJHMA8
14 August 2019 22:13
2
Hi Thomas,
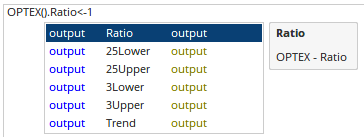
Simply type OPTEX(). and then select the output value required, ie Ratio
OPTEX().Ratio<=-1
Hi Darren,
thanks again for your fast answer.
The script works of course fine.
Hi,
I want just a bit modify the Optex Bands indicator in that way that I want calculate a moving average of the “Ratio Line”. On the chart this is of course no problem but I have some problems with the script.
I have tried the following but it does not work:
MA(CALC=OPTEX().Ratio, STYLE=Weighted, BARS=2)<=0
The script without a moving average is:
OPTEX().Ratio<=0
I thought I can change the “Close” element of “CALC=Close” with CALC=OPTEX().Ratio but as already mentioned it does not work.
Can anyone give me some advice in this issue?
Thank you very much.
DEJHMA8
15 August 2019 18:16
5
Hi Thomas,
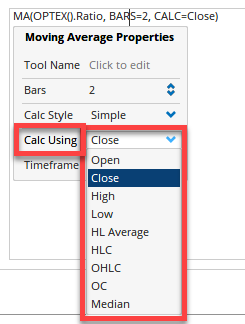
The CALC field refers to the MA, eg based on closing prices, high, etc. Click on the properties box to see available options:
Instead, the item that the moving average is calculating needs to be separated by a comma:
MA(OPTEX().Ratio, BARS=2, CALC=Close, STYLE=Weighted)<=0
For more examples of ‘nesting’ functions see the first lecture here:
https://learn.optuma.com/course/intermediate-scripting/
Hi Darren,
many thanks again for your help. The assistance I already get from you is priceless!
My next step will be the scripting courses. I have already downloaded all courses and example materials but had not yet the time to work through.
Thomas