Hi
I want to place ATR overlays around an EMA on the Force Index indicator. The standard Force Index does not have this option so I wish to know am I able to code this? I cant find where I can modify or create my own indicator.
Hi
I want to place ATR overlays around an EMA on the Force Index indicator. The standard Force Index does not have this option so I wish to know am I able to code this? I cant find where I can modify or create my own indicator.
Hi George,
You can select the moving average from the toolbox and then click on the Force Index to add it to the tool, and then right-click on the MA line and select the tool which will then be applied to the MA. I’m not sure it will work with ATR though as they are not bands. Is there a formula involved?
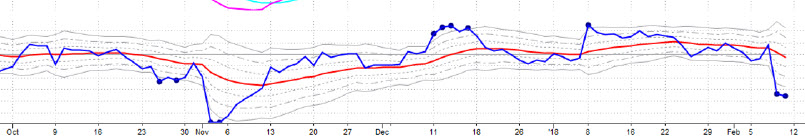
Thanks Darren, that did the trick. Learn something new everyday! After applying the MA on the Force Index, I overlaid Keltner Channels on the Force Index which act similar to what I am after. The formula I used on StockCharts is as attached.
That does lead to one question, is there a way to use similar parameters for Keltner Channels in Optuma as I do in StockCharts? ie. can have 21 for the EMA and 21 for the ATR, and a multiplier of the ATR? Effectively I wish to plot a 20 day EMA with 21 day ATR bands using Keltner channels at 1 x ATR, 2 x ATR and 3 x ATR.
Or does the Bar setting in Optuma Keltner Channels represent the length of the EMA and the time period of the ATR in the one setting?
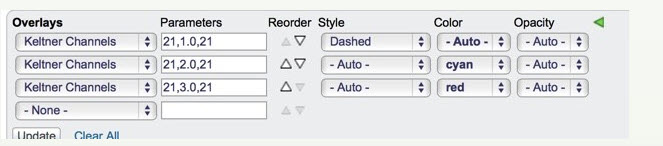
Yes the Bars property of the Keltner Channel tool is the moving average and the ATR length and the Constant is the ATR Multiplier, so you would need to apply the tool 3 times with different Constant values.
Thanks Darren