Matthew asked me to post my question here in this forum, and he will then provide an answer for all to see. Matthew, thank you in advance for any assistance that you can provide. My question is listed below:
All, is it possible in Optuma to find the percent rank of a price or indicator throughout its history (as it expands) or throughout the last X bars? This is an excel function that I would think you would have, but I could not find it. Please let me know if there is a way to set these up.
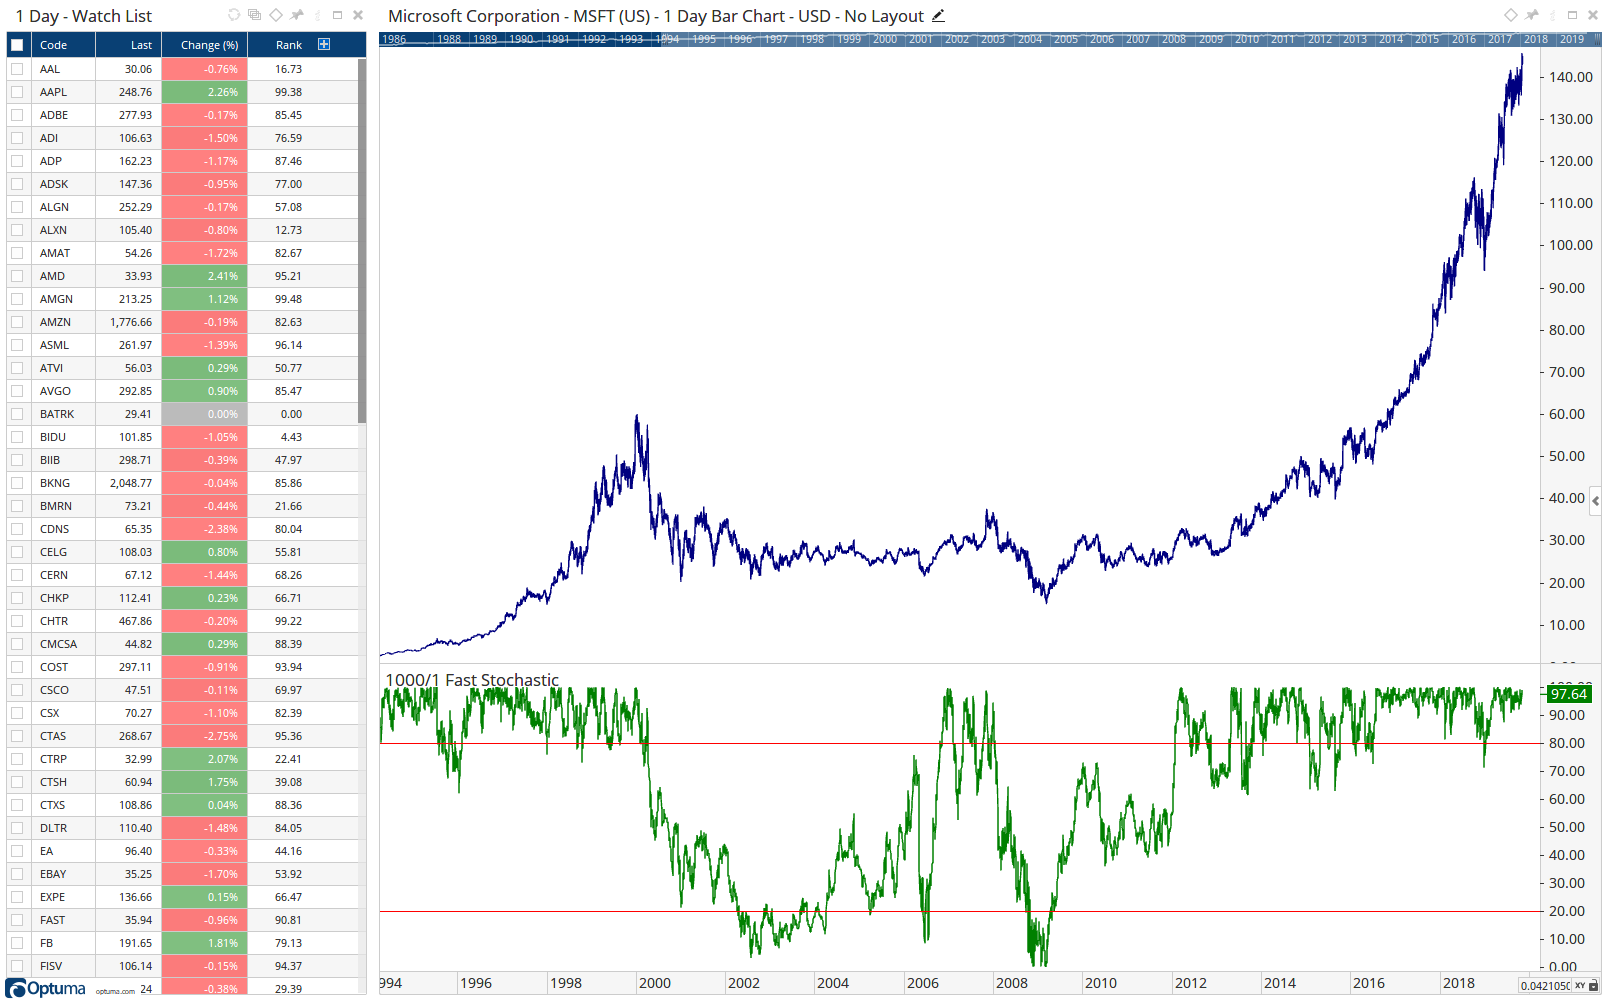
The easiest way to do this is with a Stochastic function. Essentially what the Stochastic does is look back through a range and take note of the highest and lowest prices. Then it compares the current price and provides us with a percentage value. This is a great way to normalize values for comparison.
If I was doing this on a chart, I would add a Fast Stochastic tool, set the %K to 1000 bars and hide %D (turn off “visible” in “D Plot Style”). Remember that you can save this to your tool bar from the actions menu (running man on a right click). Then you can apply this visually to price or any other indicator.
If you wanted to limit the calculation to the last year, just set %K to 252 (on a daily chart).
To achieve the same thing in scripting just use this script
STOCH(BAR1=1000)
If I wanted it on another indicator, I would first put that result in a variable
V1 = ADX().ADX;
STOCH(V1, BAR1=1000)
Here you can see where I have this in a watchlist and on a chart.
Matthew, thank you very much for the response. I tried out the stochastic method, and it works perfectly. With a scripting solution to this question, we can use the stochastics and get a percent rank for many indicators. I’d like to follow up with a few further questions.
Suppose on my indicator chart I wanted to highlight in red or green the top of bottom 5% of the indicator’s historical range. How can I make my indicator highlight to top or bottom 5%, for example. Along the same lines, if I wanted to divide and highlight the indicators range through history by say, dividing it into quartiles or deciles, how would I shade or mark up my chart accordingly?
My last request would be to get the inverse of what we’ve done with the stochastic. In the stochastic we look at for a given price where is that on a percent rank basis throughout the stated number of bars’ history. We’d like to be able to produce the inverse of that question – for the 1st percentile, 5th percentile, or 95th percentile, what is the given indicator or price reading that matches that criteria. Another way of stating this is that we are looking to use a frequency distribution table. The output for this script could be a bar chart or even just a table. Please let me know what you suggest in producing this. Thank you,
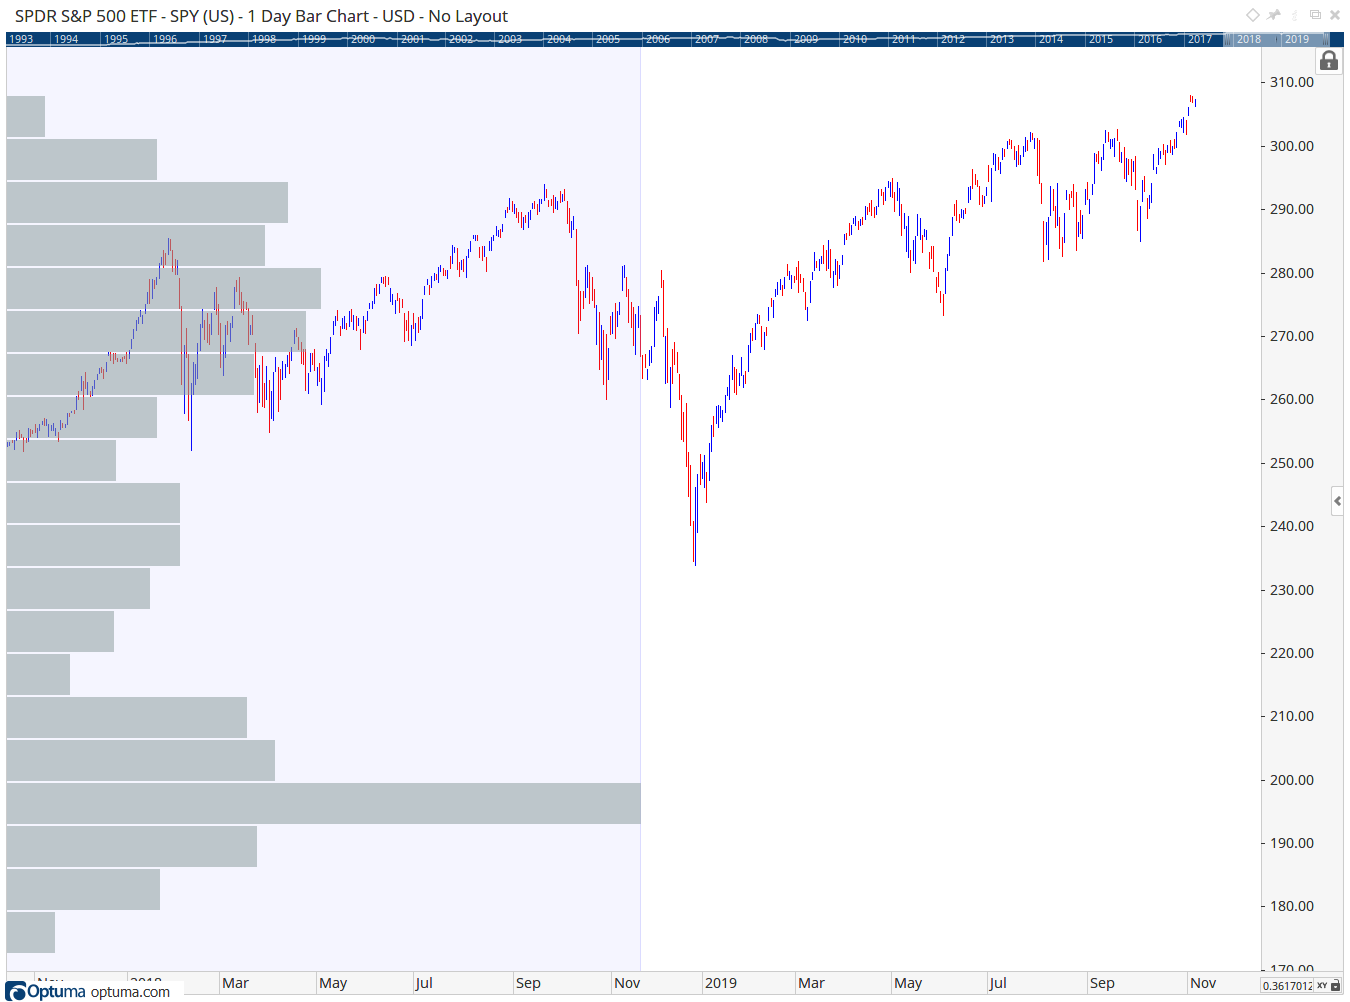
Have you looked at the Volume at Price tool (VAP)? It does have the extra concept of time spent at the various levels, but still if it is set to 20 bins with a lookback that matches your requirements, then you are going to have a really easy way to see on the chart if the price/indicator is at the top of it’s range.
With 20 bins, each of those horizontal bars represents 5% of the historical price range. The magnitude is not needed for what you are doing, but I do find it interesting to see how much time has been spent at different levels.
That may answer item 2 but not so much item 1. I would do that with an Analysis Tile tool. This is a red light / green light tool which has a script in it. So if we set the script to the following:
STOCH(BAR1=1000) > 95
Then we get this
Hopefully between the two concepts you can get what you need.