I bring this topic regarding the pivot point up since i don’t see others discuss this question before.
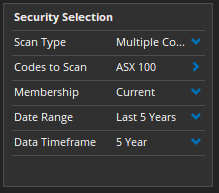
The objectif is to find stocks with a closing price on the daily chart near the 5 years chart pivot point like shown in the picture.
So i wrote the script as follow:
p1=PIVOTS(Year(Year(PERIODAMOUNT=1), PERIODAMOUNT=5),offset=1);
CLOSE()>0.97p1 and CLOSE()<1.05p1
and i set the scan manager like the follow (in this scan, i will use the closing price on 27th april 2021 here) but the scan manager turns wrong results.
I checked the knowledge base but found very little information with case like mine. So please let me know how to correct my script or the scan manager in order to get it done if you have a great idea.
I can’t see the specific Pivot properties you are using, so i have used the standard setups for now. I have been able to setup a scan that produces results for a 5 year time frame, where the Close of the last bar is within a 5% range (above or below) the Pivot line.
I used the ASX Top 100 to scan as I don’t have your CSV data set. 10 results were returned, and when i checked the charts manually, I can confirm the results returned are correct, each close was within a 5% range of the Pivot line (blue shaded zone).
Thank you for your solution. I just tried your script and here is the result.
As shown in the picture, the scan returns the result with all the securities who’s closing price near the pivot of current 5y candle’s R1 71.683.
However, my intention was to identify securities test the pivot of the previous 5y candle pivot, in this case, as shown in the picture follows, the current price should be at around 10.857.
That’s why i tried to use offset=1 in the script.
It seems like something need to be changed in the scrpit. So, what’s your take on this case ?
I think the script is working as you wanted, it does refer to the previous bars pivot value. You can confirm by placing the Pivots tool (not Pivot Points) which dynamically tracks each pivot movement on a per bar basis.
You will see the pivot value for that bar is the one being referenced. You can also confirm by using a Show Plot with the same script, but displaying the V1 Line.
Thank you for your reply. I just double checked everything since your last post.
In fact, i do get some right result with the scan manager, but i do get some wrong ones too. Here are 2 data files found by the scan manager with the script. And you can see that clearly the result isn’t right.
This remind me that 1 or 2 years ago, i talked with your colleges about a bug how optuma’s pivot shift randomly on some charts. I didn’t persist on that thing since i know that there are a lot of things to do.
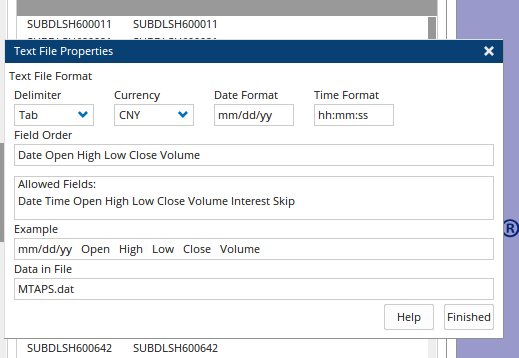
i will post 2 data files here and you can test if it works on your side too. The data’s format is defined as follow
I was able to test the files you sent. I’m currently testing a new alpha build which is where the screen shots are from, on that build the results are as expected. I did see the same issue on v1.6 however.
The build i am testing does include some improvements to the Pivot Points tool (probably related to your initial feedback). We expect the build to be out by the end of Q2 of 2021. If the issue remains after you have this new build please let me know.