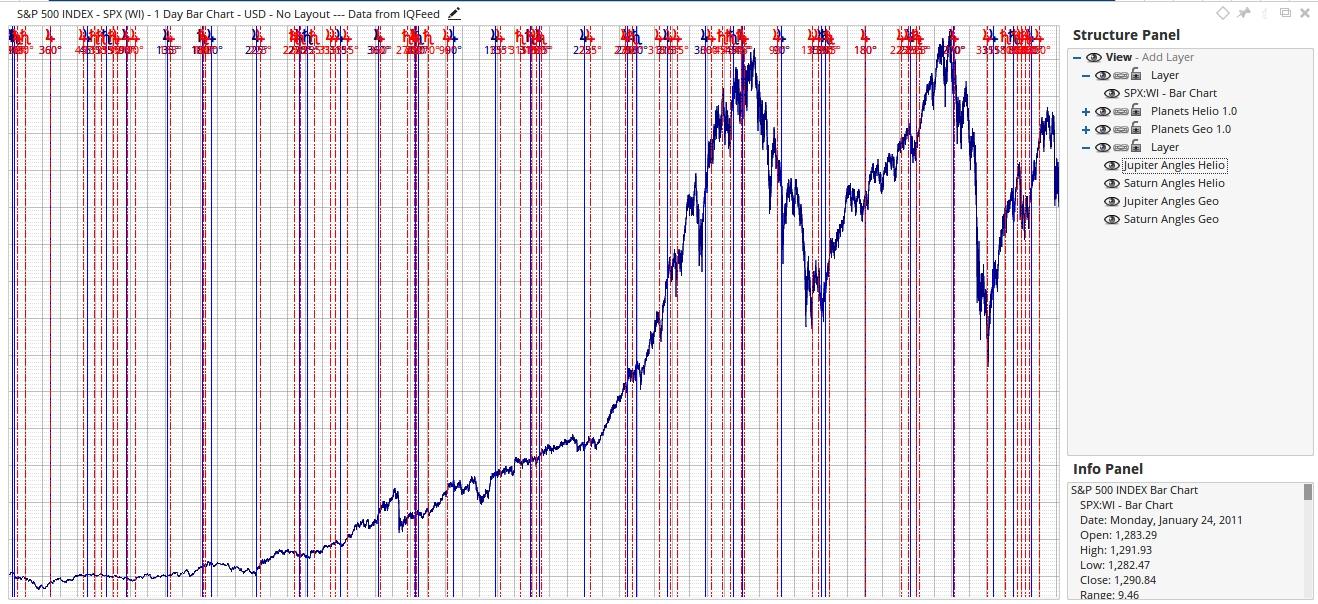
I’m not really sure of the correct terminology, but I’ve included an image showing vertical lines marking planetary angle conjunctions. How would I be able to do something like this on Optuma Gann Trader? I think this chart was made on an early version of Market Analyst.
I tried the planetary angles tools and changed the properties, but I lost the time scale slider on the top of the chart and the calendar dates on the bottom of the chart. I think the chart that I showed above had both Geo and Helio lines of Jupiter and Saturn over a 20 year time period. Somehow my chart got really congested. I change the chart time frame from daily to weekly, but the chart is still very congested. How do I solve these problems? Am I doing this correctly?
I think this might be the Time by Synodic Degrees tool, but it has been temporarily removed from the astro tool group because the geocentric calculations are incorrect. However, the heliocentric calculations are correct, so if you would like it added to your account please contact [email protected] and we’ll enable access for you.