I have 4 indices - Nifty50, Nifty Midcap 100, Nifty smallcap 100, Nifty 500
Correl1 = Correl(Nifty50, Nifty 500)
Correl2 = Correl(Nifty Midcap 100, Nifty 500)
Correl3 = Correl(Nifty smallcap 100, Nifty 500)
Avg Correl = (Correl1 + Correl2 + Correl3)/3
I want to plot the Avg Correl.
Please HELP how it can be done through your scripting framework
Hi Prashant,
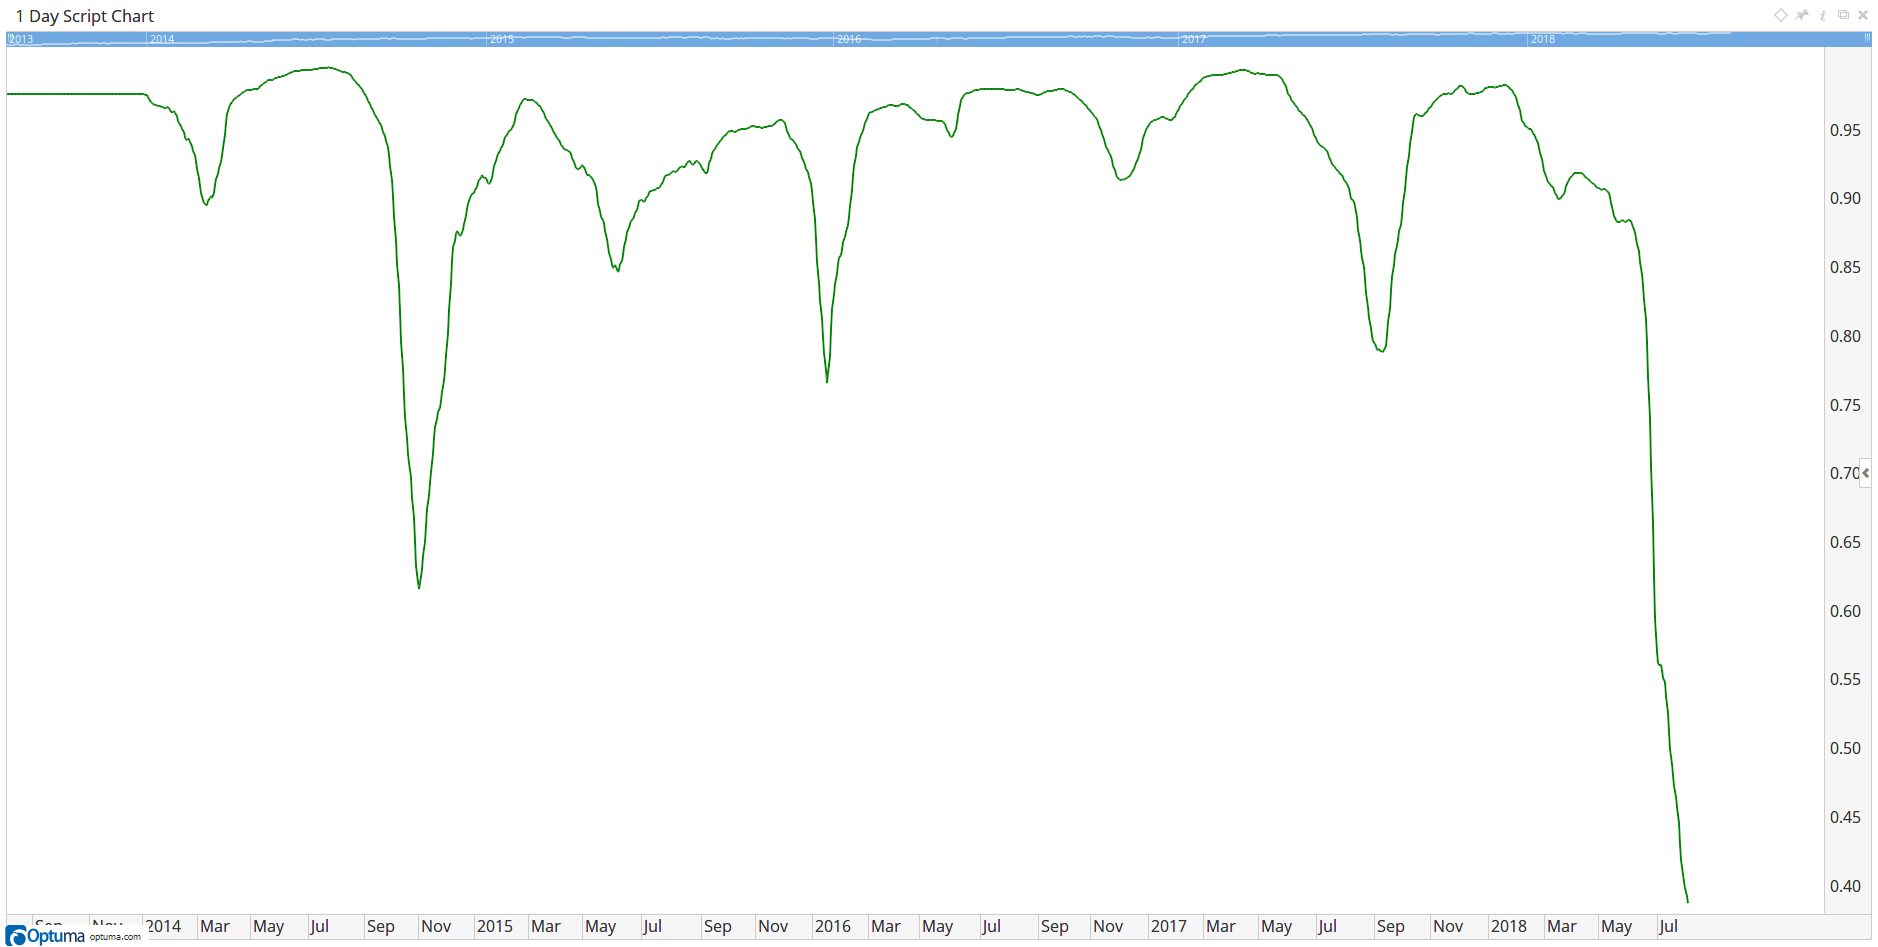
Your best option is to open a Script Chart for NIFTY500 and then use this formula to plot the average 100 day correlation:
c1 = CORREL(INDEX=NIFTY50:NSE);
c2 = CORREL(INDEX=NIFTYMIDCAP100:NSE);
c3 = CORREL(INDEX=NIFTYSMLCAP100:NSE);
(c1+c2+c3) / 3
The current value is 0.39, which is the average of the tools when plotted on the chart:

Thanks a lot Darren. Appreciate your quick reply. It helped