Hello
Is there an easy way to visually track on the chart where and when I opened a position? Ideally, I’d like to see the point I entered, and easily see the current % difference from the entry price, and the # of periods or trading days since I bought the stock. I don’t use your Order Manager. Maybe you already have a tool that would meet this need, and I missed it?
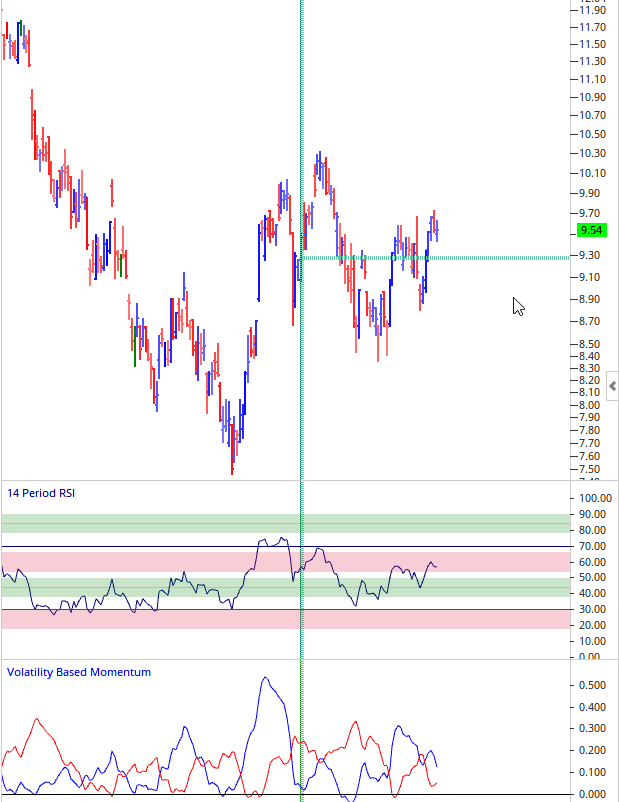
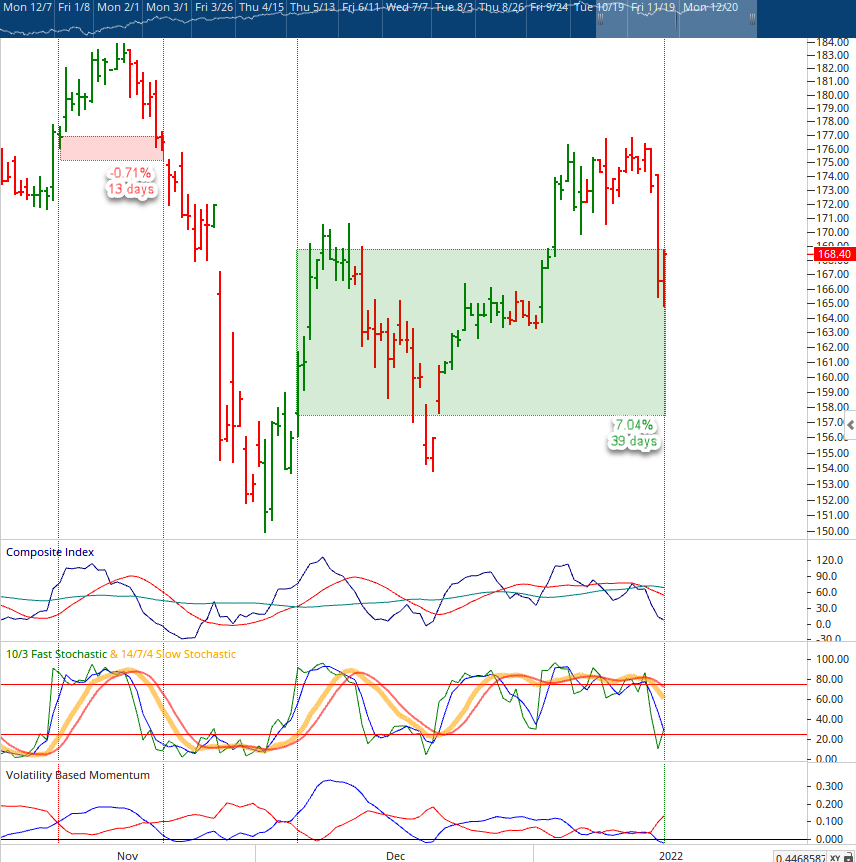
I’d like to do a better job exiting my positions if I’ve been in them too long (range bound) or the % gets large. I’ve started to manually place a Horizontal Line and a Vertical Line at my entry spot on the chart, and that works ok, but the % change and amount of time can look deceptively different on each chart. I end up using the shift-click trick to display the % change from my entry to the current price over and over again as review each chart, and it would be great if it just displayed somehow without needing to manually select the start (entry price) and end points (current price) each time. Whatever you come up with doesn’t have to be cross-bars like in my sample attached below. I see that Optima has some other tools that are similar that might be easier for you to modify. (I saw various boxes, measures, tiles and markers that seemed close, but they didn’t seem to meet this need.)
Thoughts?
Thanks!