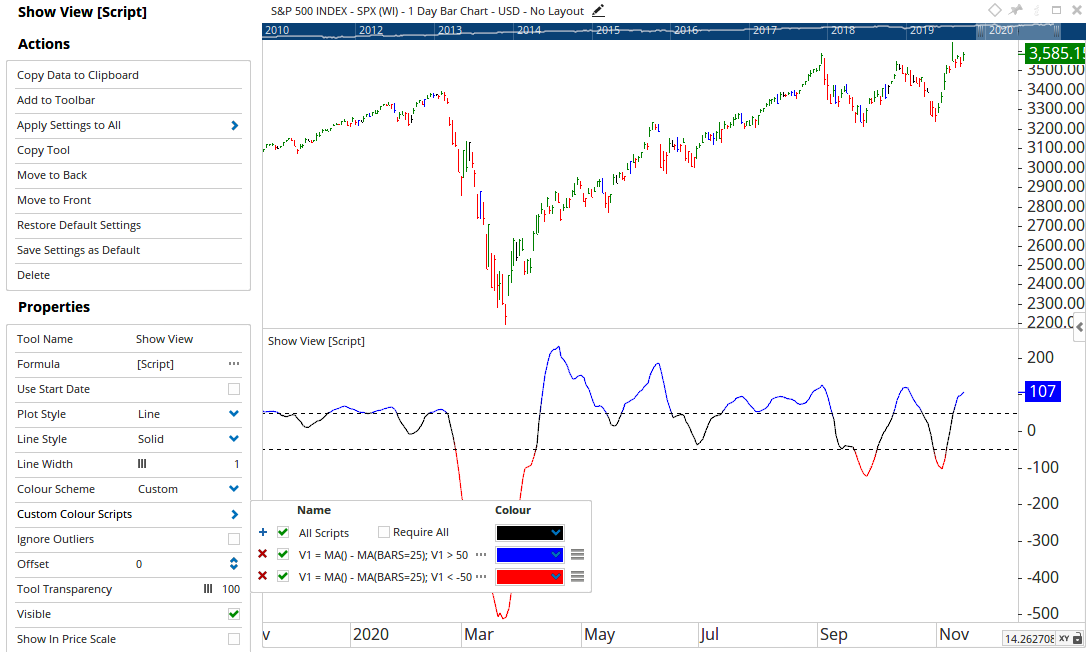
the Show View tool has in the Properties settings the option to change the Colour Scheme to Positive/Negative and then set the colours for Positive and Negative values as well as the Positive/Negative Barrier. That is a really good option.
As you can see on my screenshot below I have set the Positive/Negative Barrier to “40” so that all values below “40” are colored red and the rest of the values are colored blue.
I would recommend a feature that allows to colour not only the values below “40” but also the values above “80”. So the values above “80” would have e.g. the colour green, the values between “40” and “80” are blue, and the values below “40” are red.
This would require a “Second” Positive/Negative Barrier option and a colour setting for the “Second” Positive/Negative Barrier.
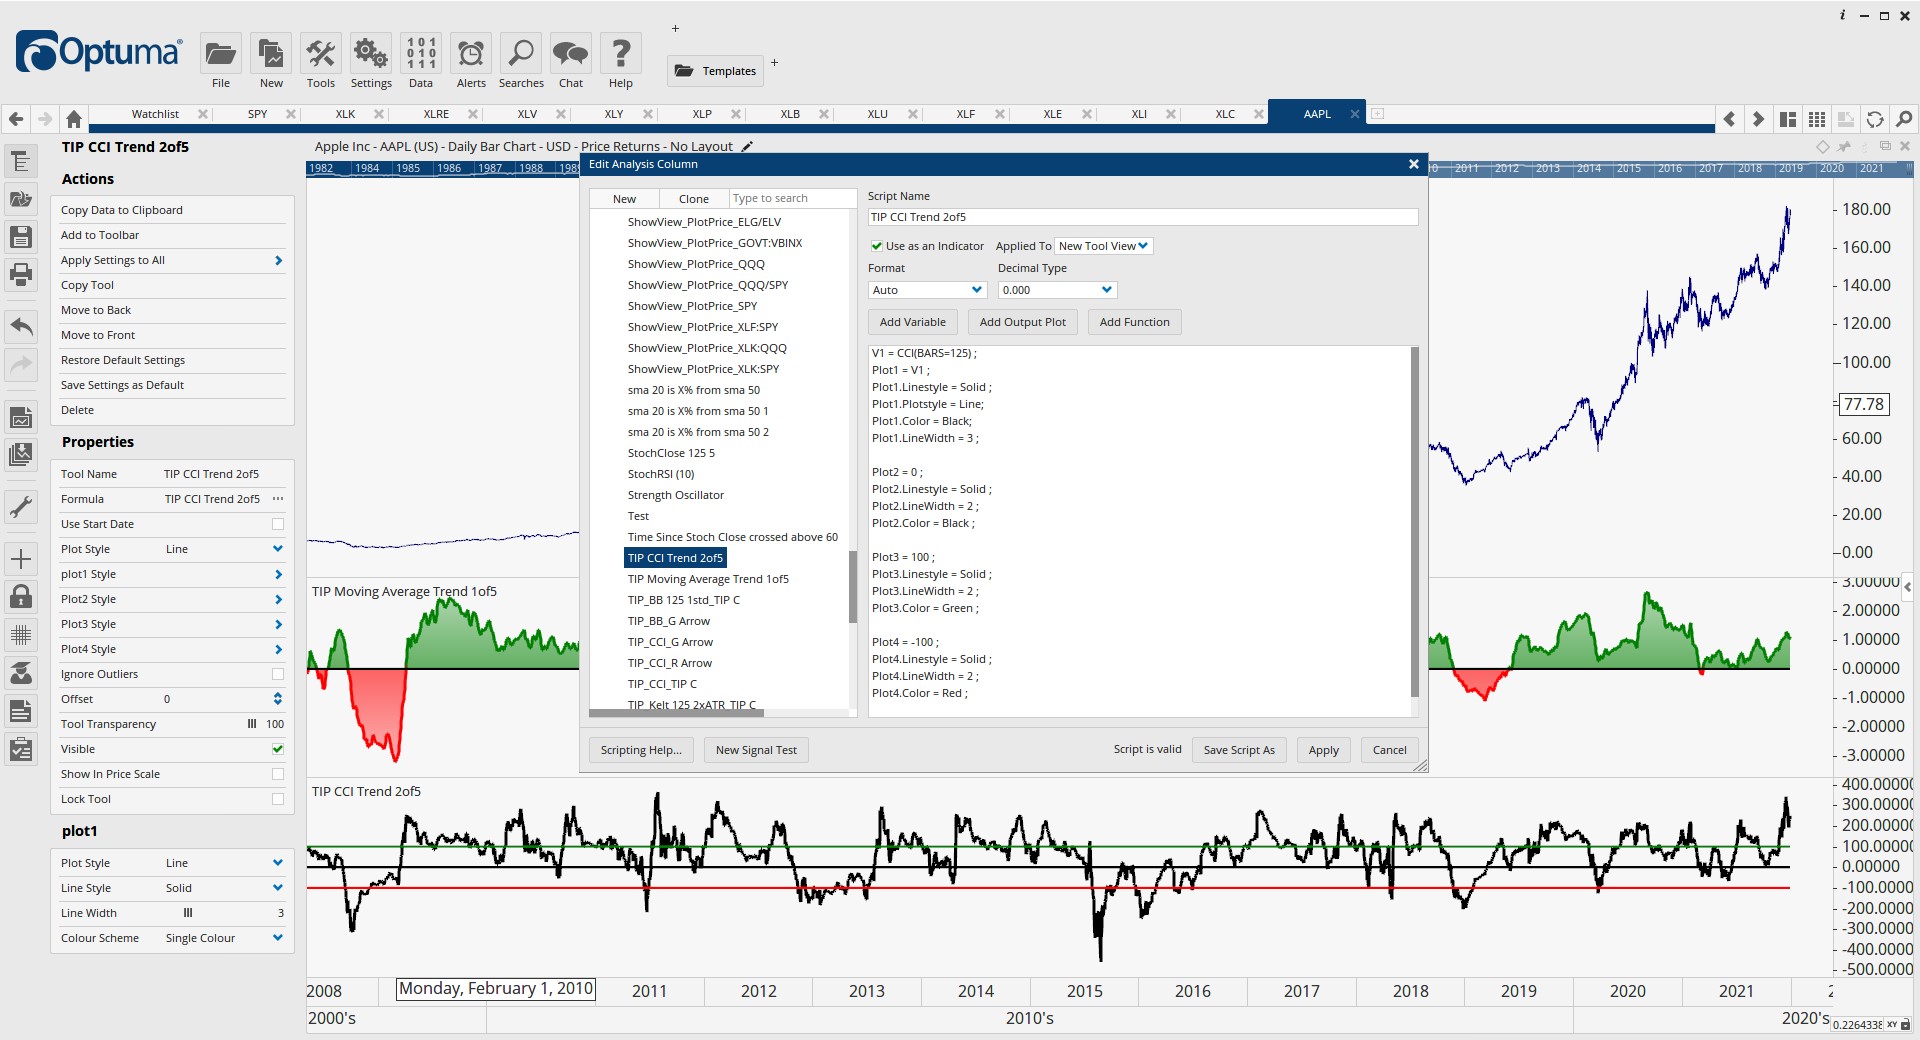
Building on this thread. I would like to script a custom color scheme into a custom indicator so I do not have to load the tool, change the color scheme to custom, and then add the scripts each time I open the tool. Please take a look at the attached picture. You can see the CCI tool I scripted adding a few colored horizontal plots. Plot1 is the actual CCI, and it is a solid black line with a width of 3. I would the line to turn green above +100 and red below -100. I have tried many things without success. I would appreciate your input here.
If you want to use custom colours, don’t reference the plots colour specifically in the script the way you have for V1 in your example image.
Once done, setup the custom colour rules in the tools properties, then save that tool to your custom tool bar for quick use in the future. The custom colours will be remembered as part of the tools properties and will appear automatically each time it is applied from the tool bar.
The script works fine, so with the script there is no problem.
I have then changed the colour settings of the plots using the properties settings of Plot1 Style, Plot2 Style, Plot3 Style, Plot4 Style, and Plot5 Style. That too worked fine BUT when I close the workbook and reopen it all my colour settings are gone.
What can I do so all my colour settings are saved. I know of course that I can script the Plot.Linestyle, Plot.LineWidth, and Plot.Color but using the properties settings allows more colour settings.
I have the same issue with the colors not saving. This happens when I save it as a custom tool and when I save the settings as s default. That is why I was trying to script the colors. I am running Optuma 2.0, build 99.
I’ll run some tests today to see if I can repeat it the issue and log it with the dev team. If not I’ll come back to find out if there are any specific steps i might be missing.