I need help with a script that would create a chart indicator showing the percent price (close) is above or below the moving average (e.g., 200 day simple moving average)
Thanks,
Paul
I need help with a script that would create a chart indicator showing the percent price (close) is above or below the moving average (e.g., 200 day simple moving average)
Thanks,
Paul
Hi Paul,
The following script will display the value (in %) the close price of a chart is from a 200SMA:
//Set Variables
V1 = MA(BARS=200) ;
V2 = CLOSE();
//Formula for % from MA
100 * (V2-V1)/V1
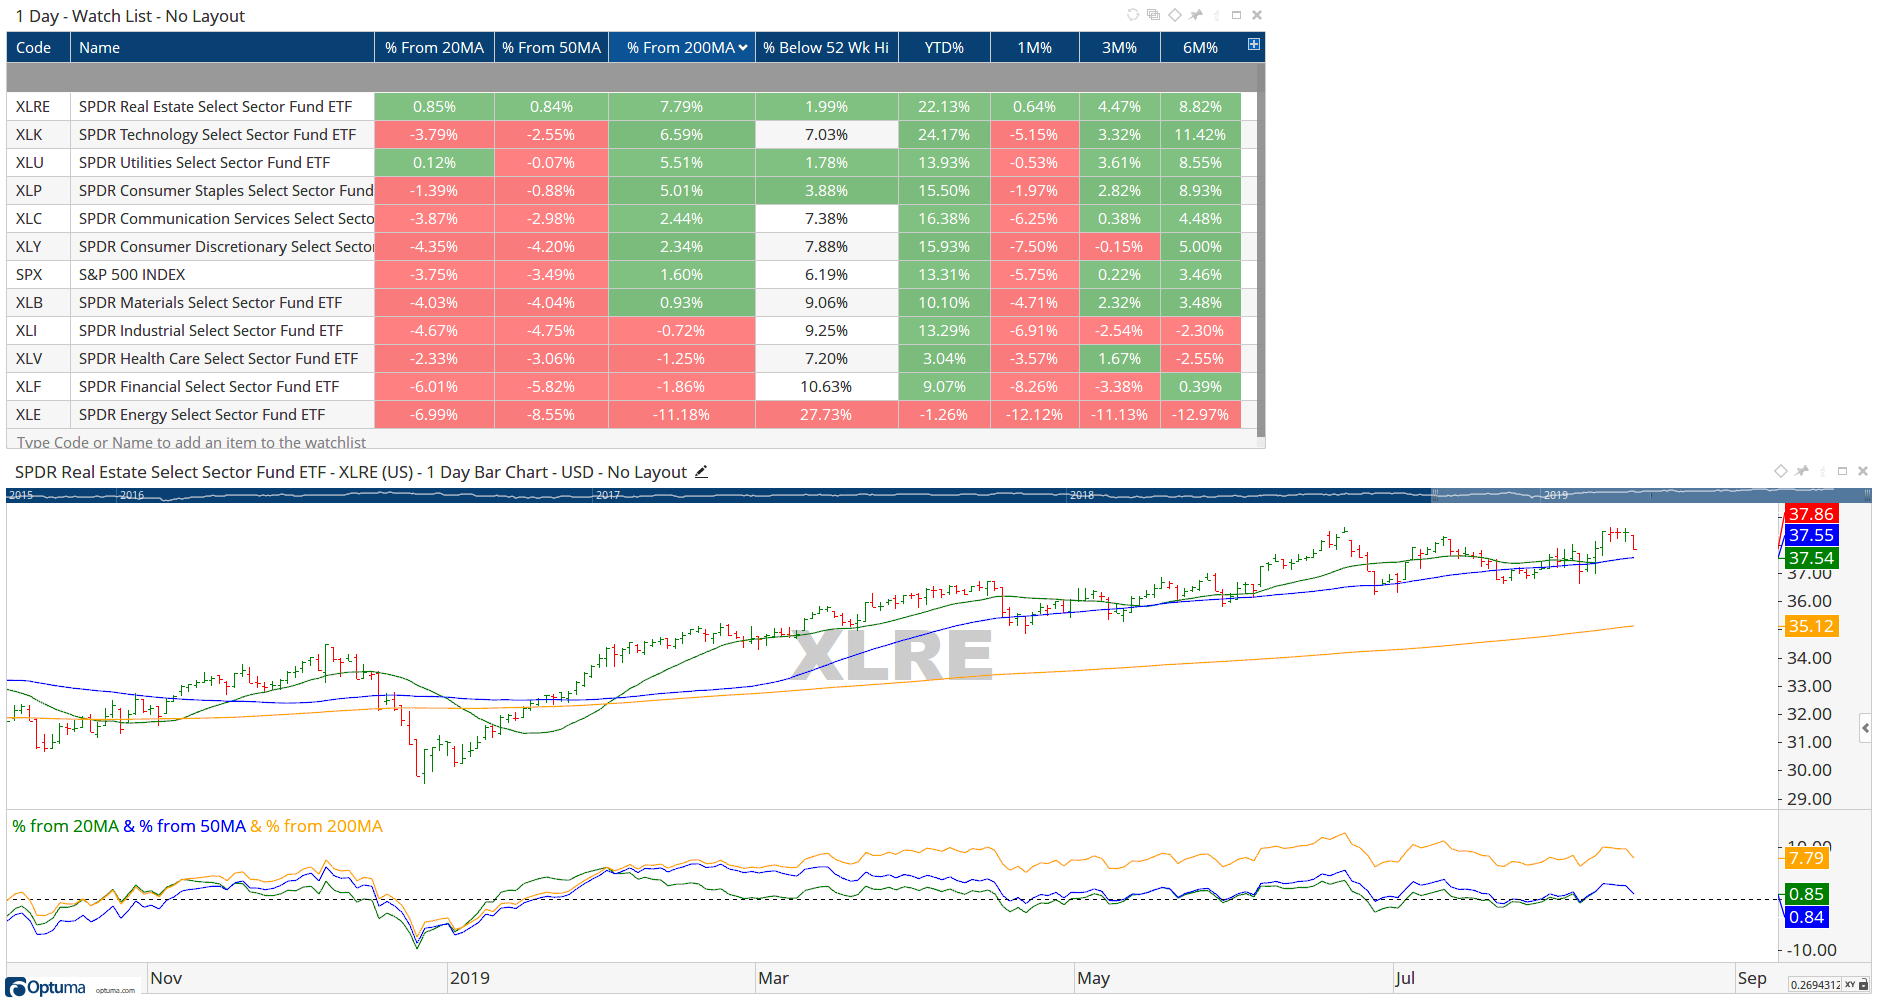
This is how the script would look on a Show View (below the chart):

Thanks, Matthew - just what I needed. Much appreciated - Paul
Sample workbook attached for US and ASX data. Remember you can save the Watchlist columns as a layout and apply them to any other watchlist.
Pct-From-MA.owb (88.7 KB)
I used this template
can I know why the column % below 52 week high is partly in white and does not take the red and green formatting?
Hi Lorenzo,
The custom colour formatting in this example was set to green for within 5% of the 52 week high and red when more than 20% away, so those between 5% and 20% were not defined.
To modify, right-click on the column heading and change the conditional values under Custom Labels: