Price Range Script Error

Hi,

I’m trying to use this script to scan for prices that have moved less than 10% in the last 10 bars.

However it is returning price ranges up to 20%

//Set Price Variables
H = HIGHESTHIGH(BARS=20);
L = LOWESTLOW(BARS=20);
//HH - LL Price Range
R = H - L; 
//Price Range as a % of HH < 10%
(R/H < 0.1)

Tim

Hi Tim,

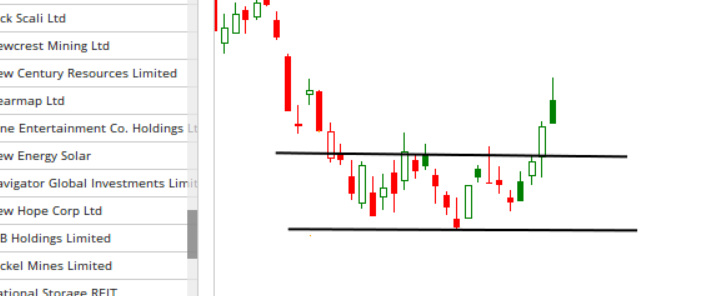
I would calculate the Daily % Range, then use BarsTrue() to find where it was less than 10% over the last 10 days.

Script Example:

//Find High / Low Range as a %
V1 = (ABS(Low() - High()) / HIGH()) * 100 ;
//High Low Range % is less than 10%
V2 = V1 <= 10 ;
//Last 10 Bars have had a Range of 10% or less
BARSTRUE(V2) == 10

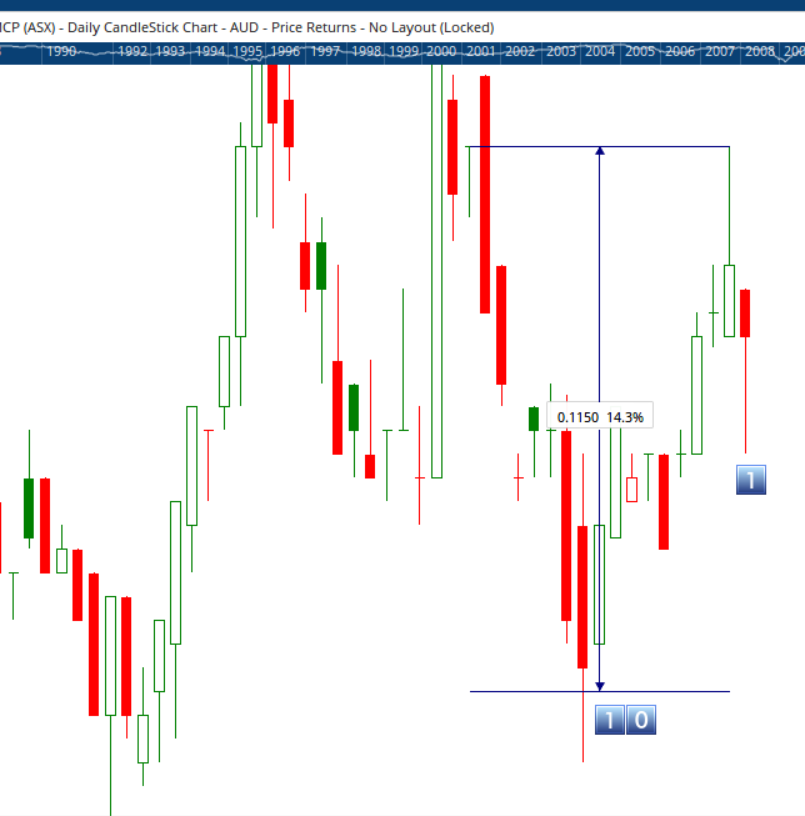
If you mean has moved less than 10% over the entire 10 day period (not on a daily basis) a ROC would work.

ROC(BARS=10) <= 10

Hi Matthew,

Thanks. I didn’t occur to me to work it out on a bar by bar basis.

Tim

Hi Matthew,

I’m still getting a few outside <=10.

Please see attached workbook.

Tim

ROC10-Less-than-10.owb (194 KB)

Hi,

The ROC() uses Close only to compare. Are you wanting to include High and Low ranges within the scope of % movement over that 10 day period?

Hi Matthew,

I’m trying to scan for “consolidation patterns”.

Number of bars, say 20, that are trading in a price range, say less than 10%.

I’ve attached an example.

Thanks,

Hi Tim,

This will calculate when the percentage difference between the 10 day high and low is less than 10%:

H1 = HIGHESTHIGH(RANGE=Look Back Period, BARS=10, INCBAR=True);
L1 = LOWESTLOW(RANGE=Look Back Period, BARS=10, INCBAR=True);
//Calc % range;
1-(L1/H1) < 0.1


Hi Darren,

Thanks - that’s the calculation I was looking for.

However when I run the script in the Scanning Manager I am still getting some results outside the 10%.

See attached Daily Chart.

I must be making a mistake with the Scanning Manager.

The settings I am using are ASX All Ords/Current Membership/Date Range - Last Week/Date Timeframe- 1 Day/Display - Latest Match.

Hi,

Apply V1 and V2 to your charts using a Show Plot and you will see why the result is being returned. Highest High and Lowest Low values are dynamic, what covers a 10% range today may be different to the 10% range 5 days ago.

If you are only using the script to scan with (don’t need historical matches) you could wrap V1 and V2 in a LAST() function, this should give you the result you are expecting.

Hi Matthew,

By applying the variables as a Show Plot I can see what you are saying and the difference when using LASRT().

Thanks.