DEJHMA8
5 August 2017 02:30
1
***UPDATE***
This tool is now included in the software , so no longer requires to be built using the scripting language.
***********************************
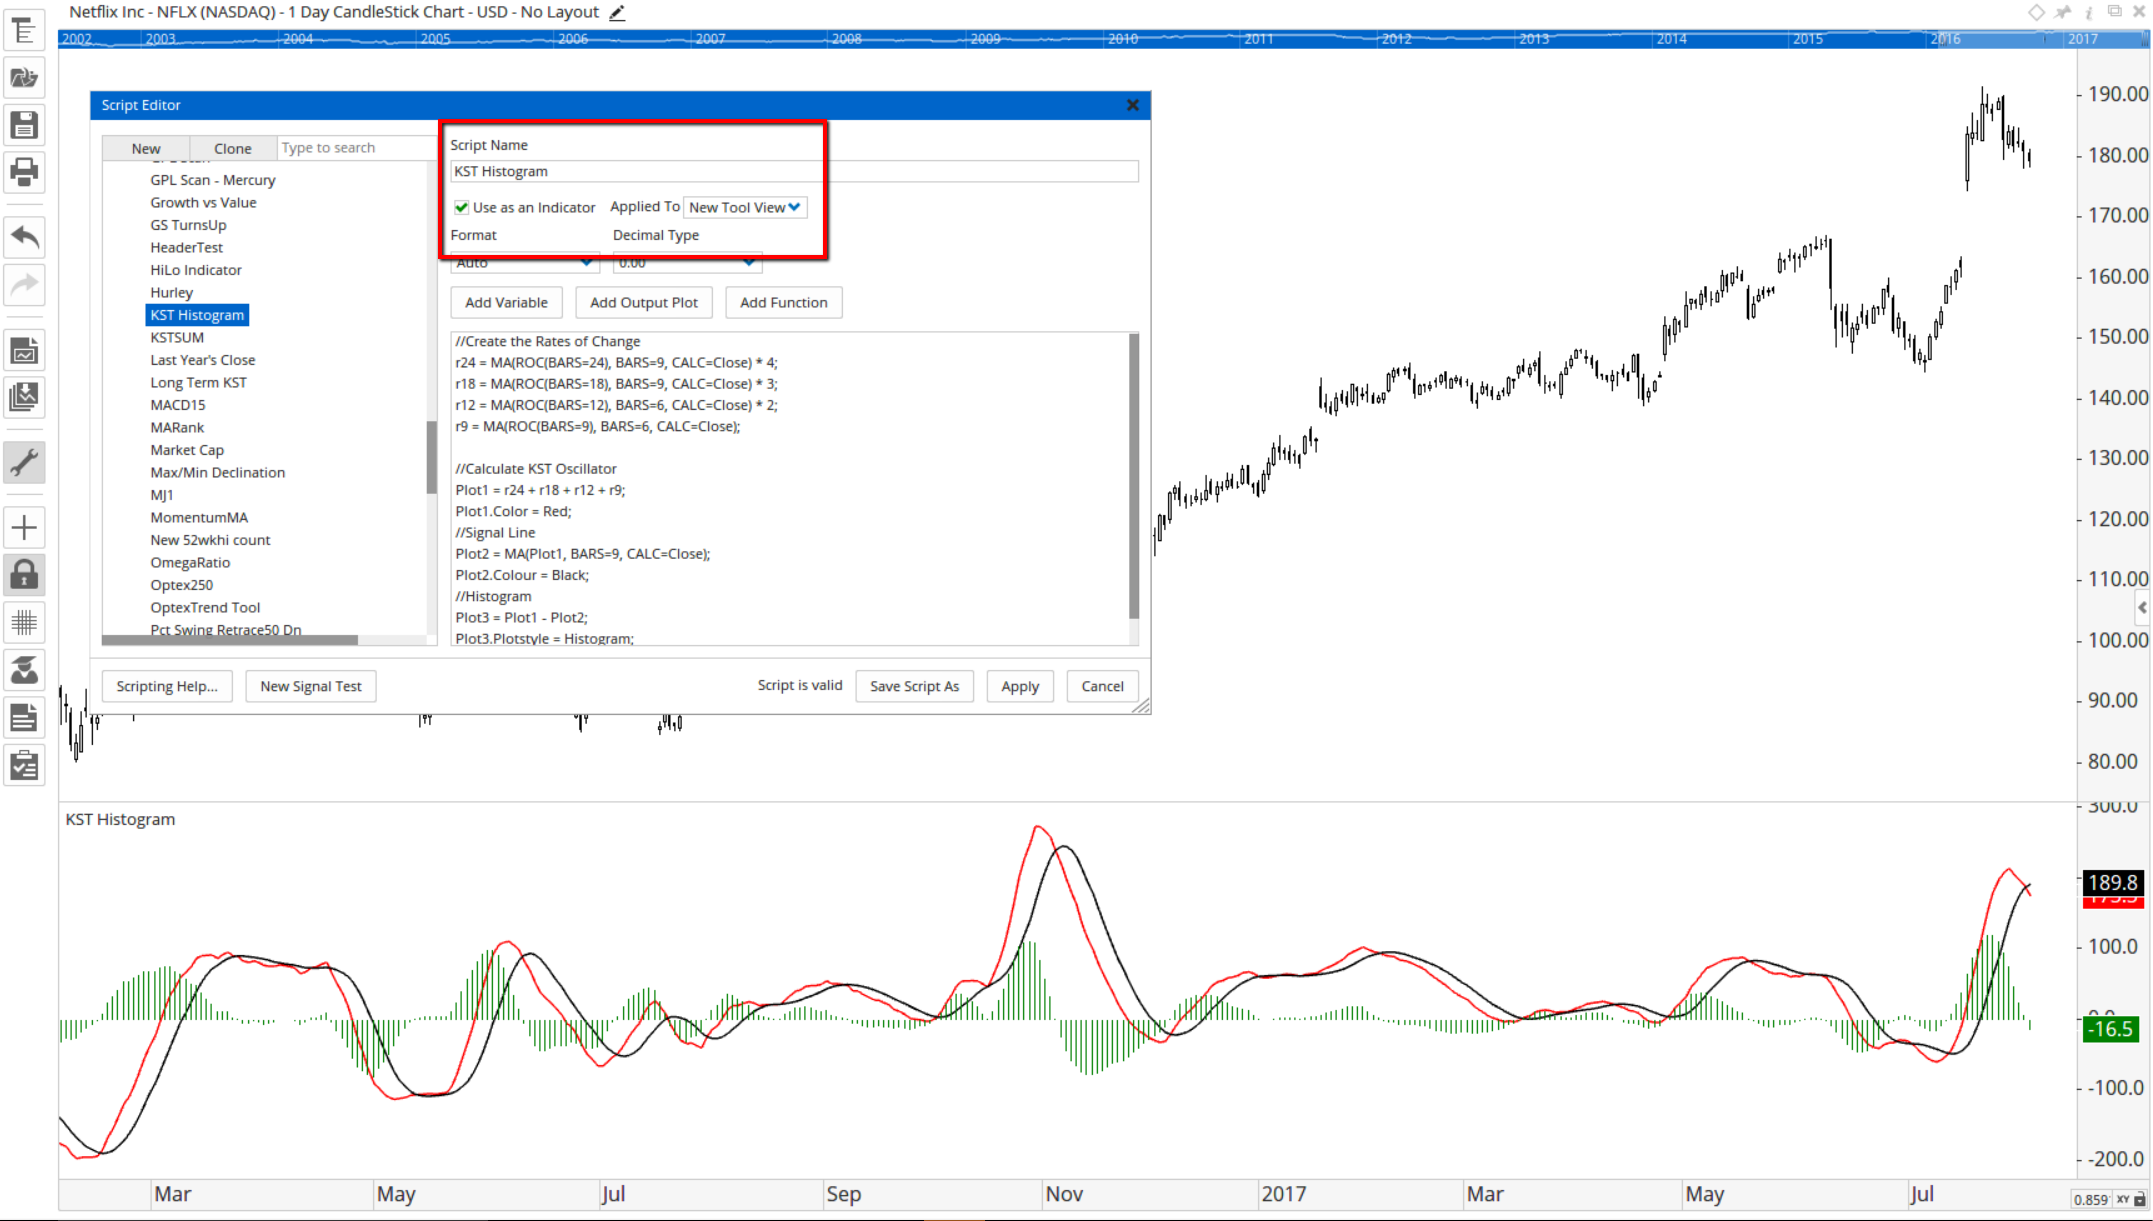
Developed by Martin Pring, Know Sure Thing (KST) is a momentum oscillator based on the smoothed rate-of-change for four different timeframes. In short, KST measures price momentum for four different price cycles. It can be used just like any momentum oscillator. Chartists can look for divergences, overbought/oversold readings, signal line crossovers and centerline crossovers.
//Create the averages of the Rates of Change r24 = MA(ROC(BARS=24), BARS=9, CALC=Close) * 4; r18 = MA(ROC(BARS=18), BARS=9, CALC=Close) * 3; r12 = MA(ROC(BARS=12), BARS=6, CALC=Close) * 2; r9 = MA(ROC(BARS=9), BARS=6, CALC=Close);
//Calculate KST Oscillator Plot1 = r24 + r18 + r12 + r9; Plot1.Color = Red; //Signal Line Plot2 = MA(Plot1, BARS=9, CALC=Close); Plot2.Colour = Black; //Histogram Plot3 = Plot1-Plot2; Plot3.Plotstyle = Histogram;
Save the script as an indicator in a new tool view and it will be added to your Toolbox:
Hello Darren,
A few comments on the Pring's KST Indicator.
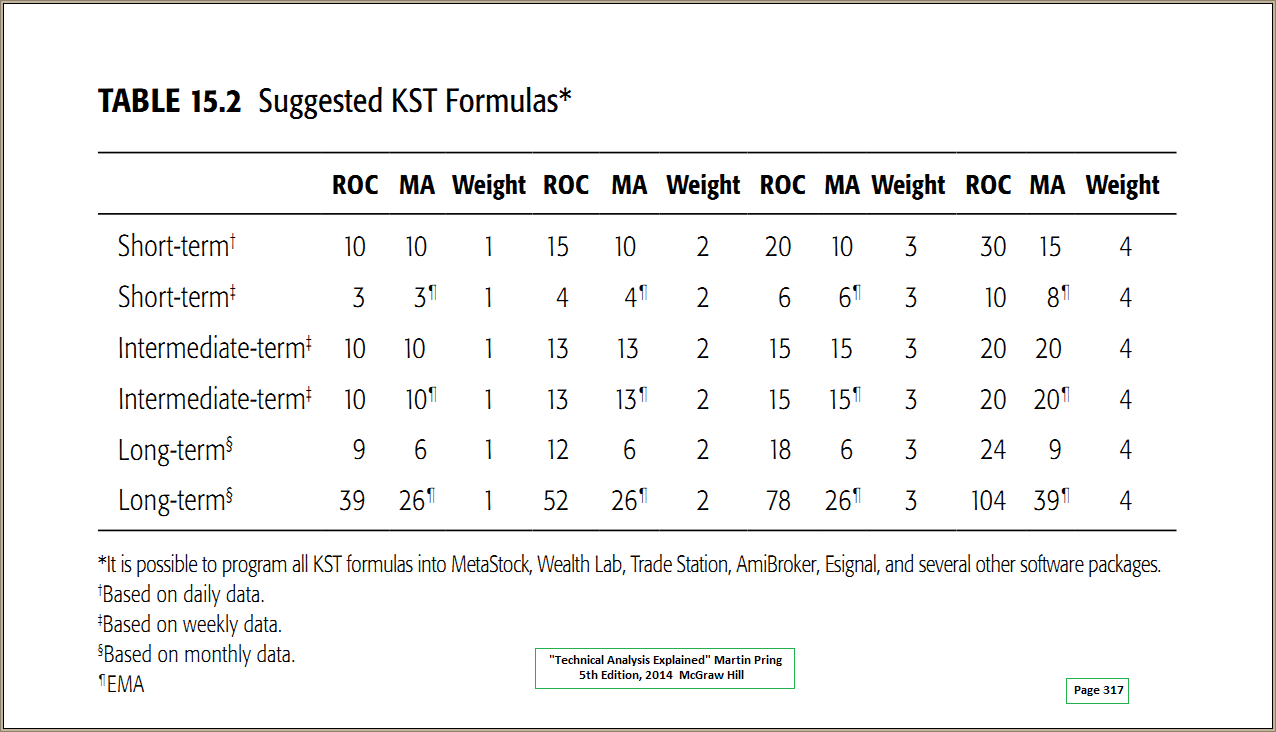
These parameters from Pring are in his book "Technical Analysis Explained", 5th Edn, 2014, McGraw Hill; page 317.
The parameters you have used are for Weekly Data....the 5th set of parameters of the 6 offered. May need to mention this to your viewers.
I coded the Daily Fast KST as below:
// -------Know Sure Thing (KST) Indicator-FAST-------<br />// --------Martin Pring----Aug and Sept 1992----------<br />// -------Signal...9 bars recommended...5 is better---<br />// ------------STOCKS & COMMODITIES-----------------<br />// --------------------------------------------------------------<br />RCMA1 = MA(ROC(10), BARS=10);<br />RCMA2 = MA(ROC(15), BARS=10);<br />RCMA3 = MA(ROC(20), BARS=10);<br />RCMA4 = MA(ROC(30), BARS=15);<br />// ---calculate KST Oscillator and Signal---<br />KST = (RCMA1) + (RCMA2 * 2) + (RCMA3 * 3) + (RCMA4 * 4);<br />KSTsignal = MA(KST, BARS=5);<br />// ---Plot KST Osc---<br />Plot1 = KST;<br />Plot1.Color = Red;<br />// ---Plot KST Signal---<br />Plot2 = KSTsignal;<br />Plot2.Color = Blue;<br />// ---Plot Histogram---<br />Plot3 = Plot1 - Plot2;<br />Plot3.PlotStyle = Histogram;
Works fine. (..although yours is probably more elegantly coded).
Keep up your good work!
Regards.....John
Darren,
My error....in the post above I said WEEKLY, should have said MONTHLY.
Apologies.
Regards....John
DEJHMA8
16 August 2017 01:25
4
Thanks John. Here’s the monthly version:
RCMA1 = MA(ROC(MONTH(), BARS=9), BARS=6, CALC=Close); RCMA2 = MA(ROC(MONTH(), BARS=12), BARS=6, CALC=Close) * 2; RCMA3 = MA(ROC(MONTH(), BARS=18), BARS=6, CALC=Close) * 3; RCMA4 = MA(ROC(MONTH(), BARS=24), BARS=9, CALC=Close) * 4; RCMA1 + RCMA2 + RCMA3 + RCMA4
system
22 August 2017 15:23
5
Hi Darren,
When i copy past KST Histogram script in my optume error occur see in screen shot
DEJHMA8
23 August 2017 22:45
6
Thanks Mohd. There was an issue with the minus sign when copied to the script editor, so please try copying and pasting the amended script above and see how you go.
DEJHMA8
7 October 2017 04:58
7
To find when the KST crosses the signal line use the following in a Show Bar or scan formula.
Cross Above:
//Create the Rates of Change
KST1 = r24 + r18 + r12 + r9;
Cross Below:
//Create the Rates of Change
In this example the Show Bar has been set to Lines instead of Arrows: