Hi guys,
Please see the script below.
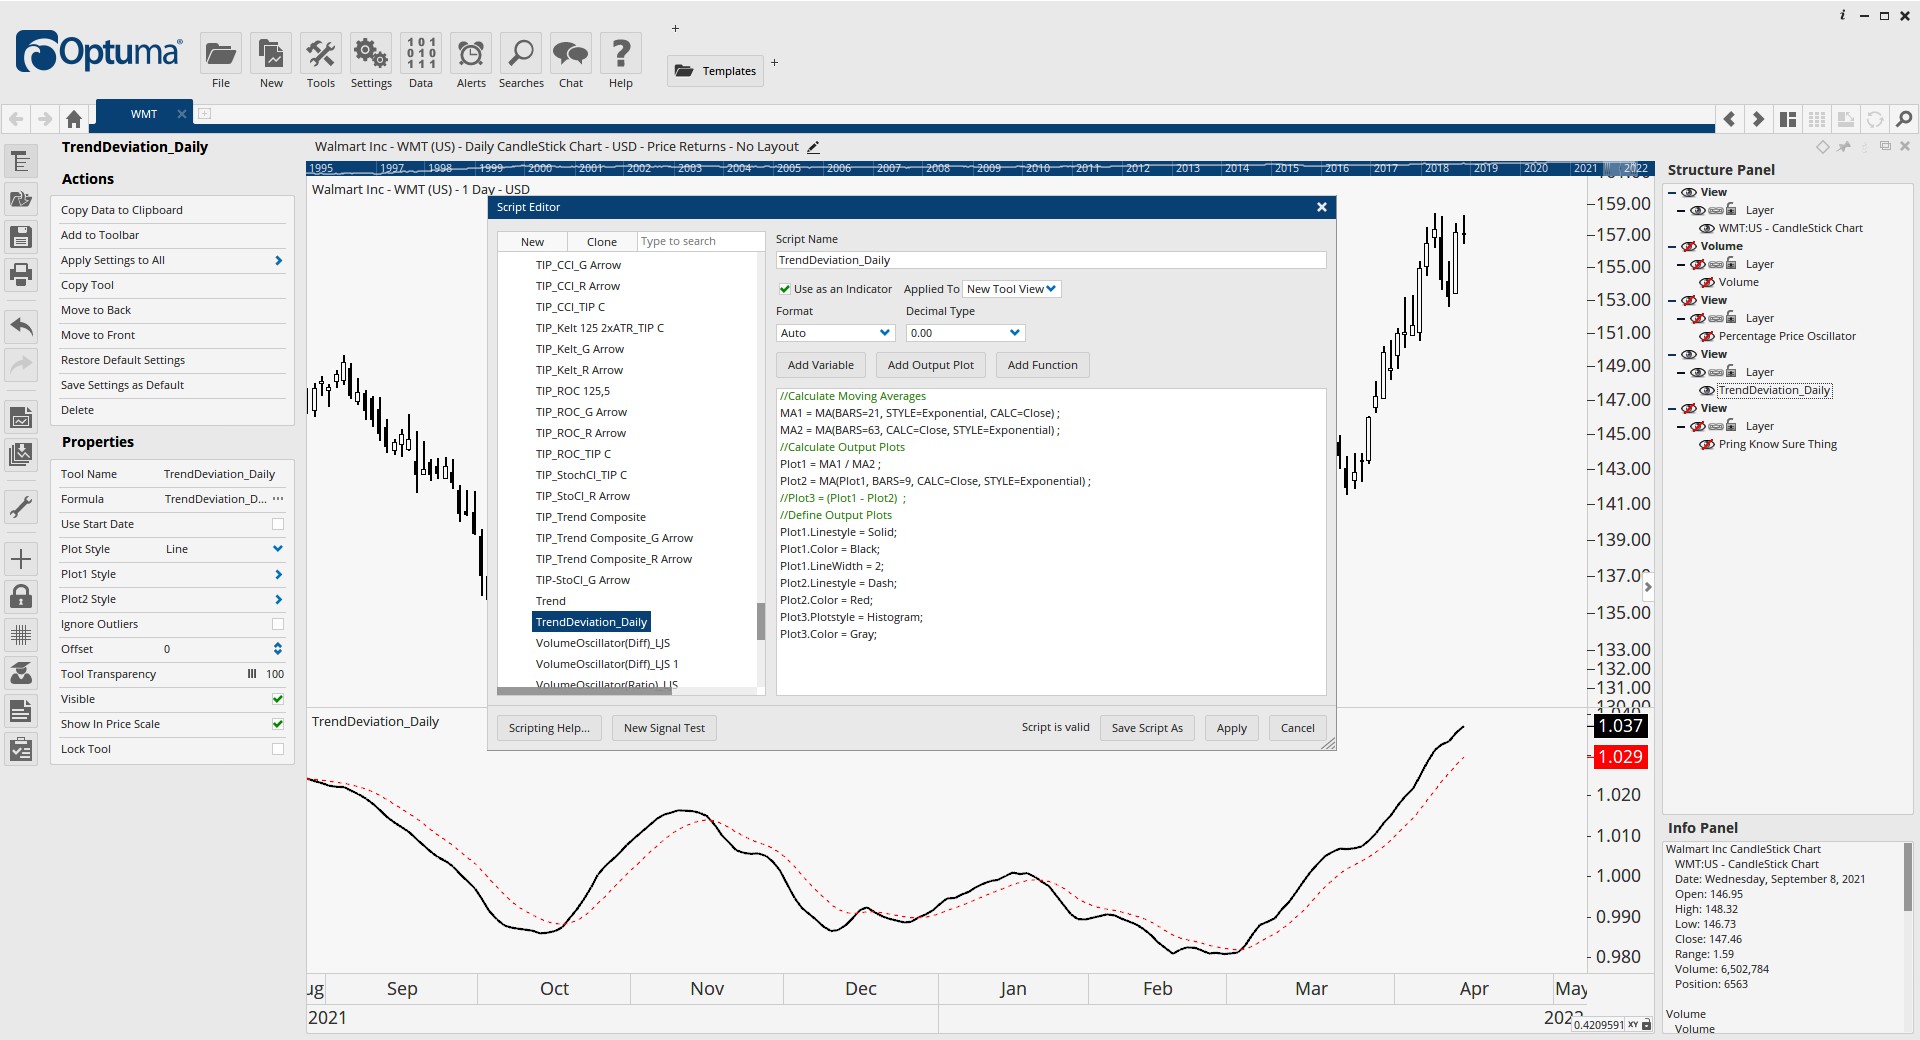
//Calculate Moving Averages
MA1 = MA(BARS=21, STYLE=Exponential, CALC=Close) ;
MA2 = MA(BARS=63, CALC=Close, STYLE=Exponential) ;
//Calculate Output Plots
Plot1 = MA1 / MA2 ;
Plot2 = MA(Plot1, BARS=9, CALC=Close, STYLE=Exponential) ;
Plot3 = (Plot1 - Plot2) ;
//Define Output Plots
Plot1.Linestyle = Solid; Plot1.Color = Black;
Plot1.LineWidth = 2;
Plot2.Linestyle = Dash;
Plot2.Color = Red;
Plot3.Plotstyle = Histogram;
Plot3.Color = Gray;
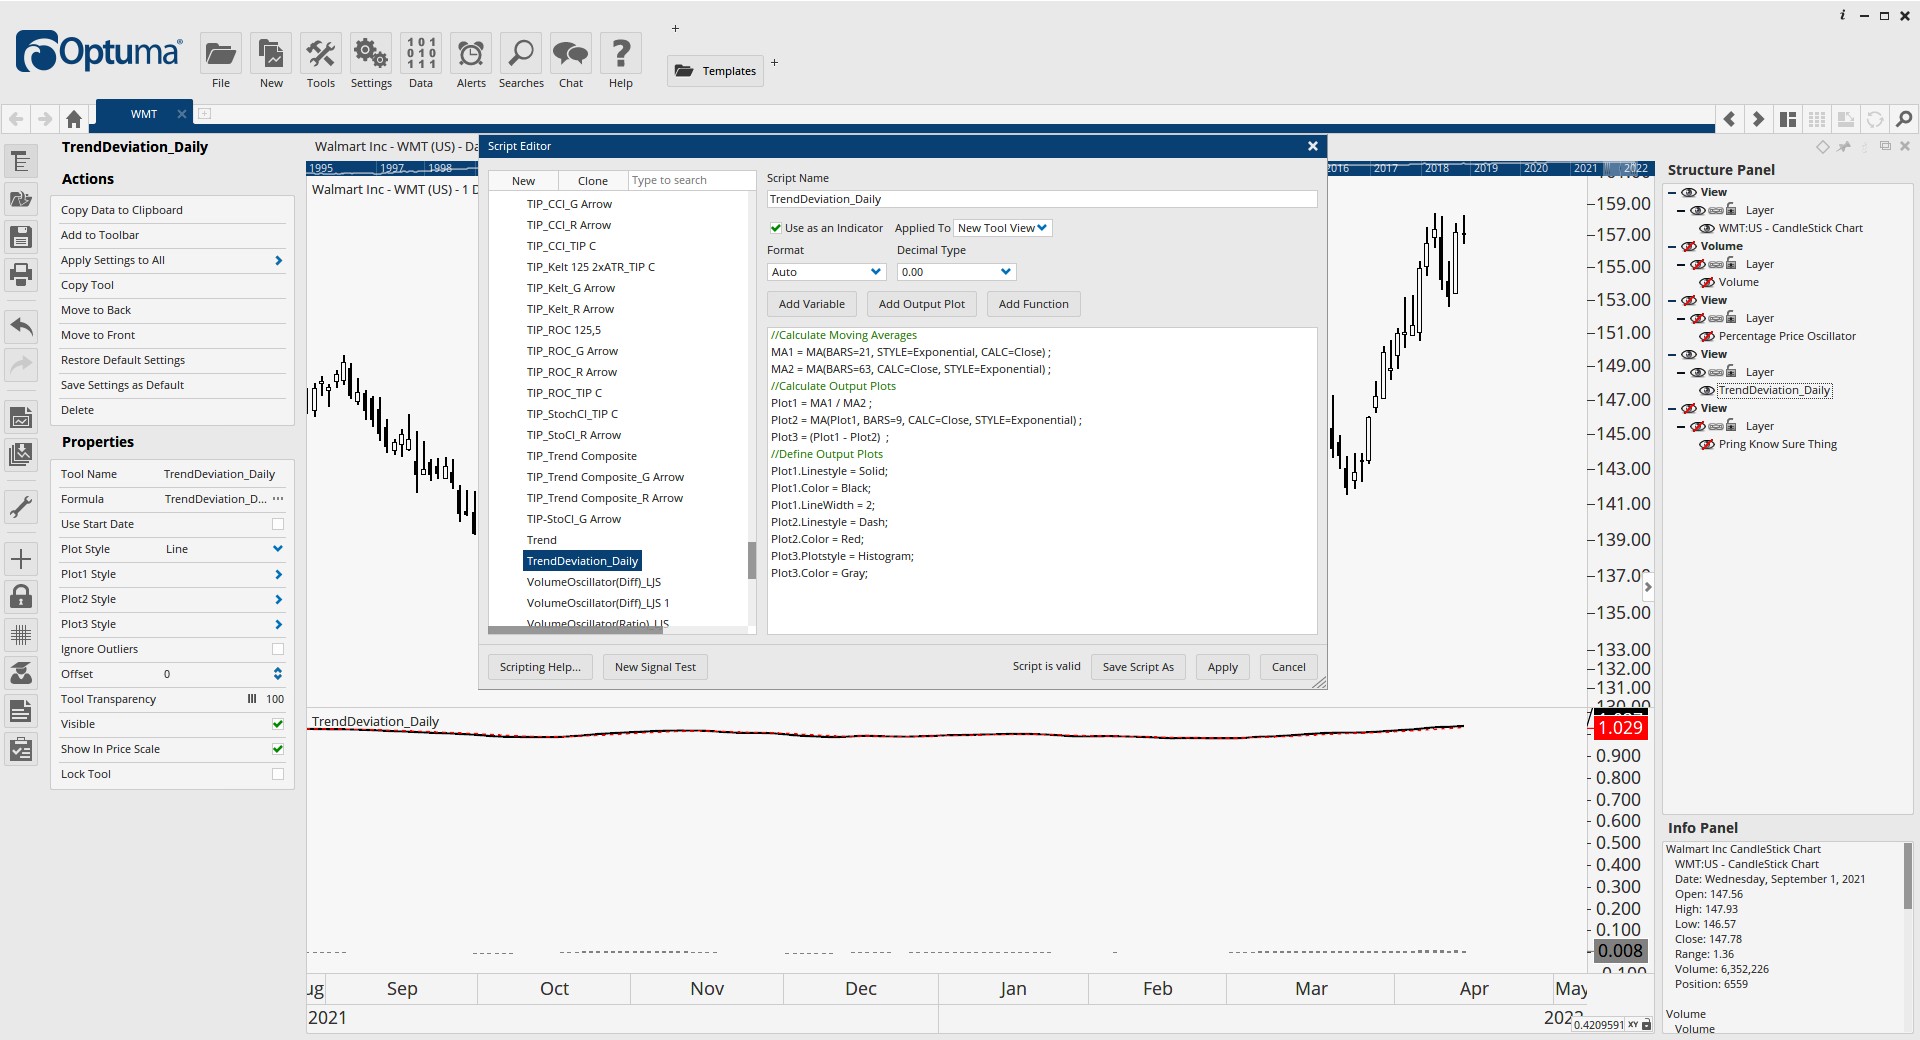
Plots 1 and 2 work perfectly - see picture 1. The problem I am having is when trying to display a histogram, called plot 3, which will subtract plot 2 from plot 1. Picture 2 is what happens. Please advise on how to correct this script so the histogram displays properly.
many thanks!
Hi Louis,
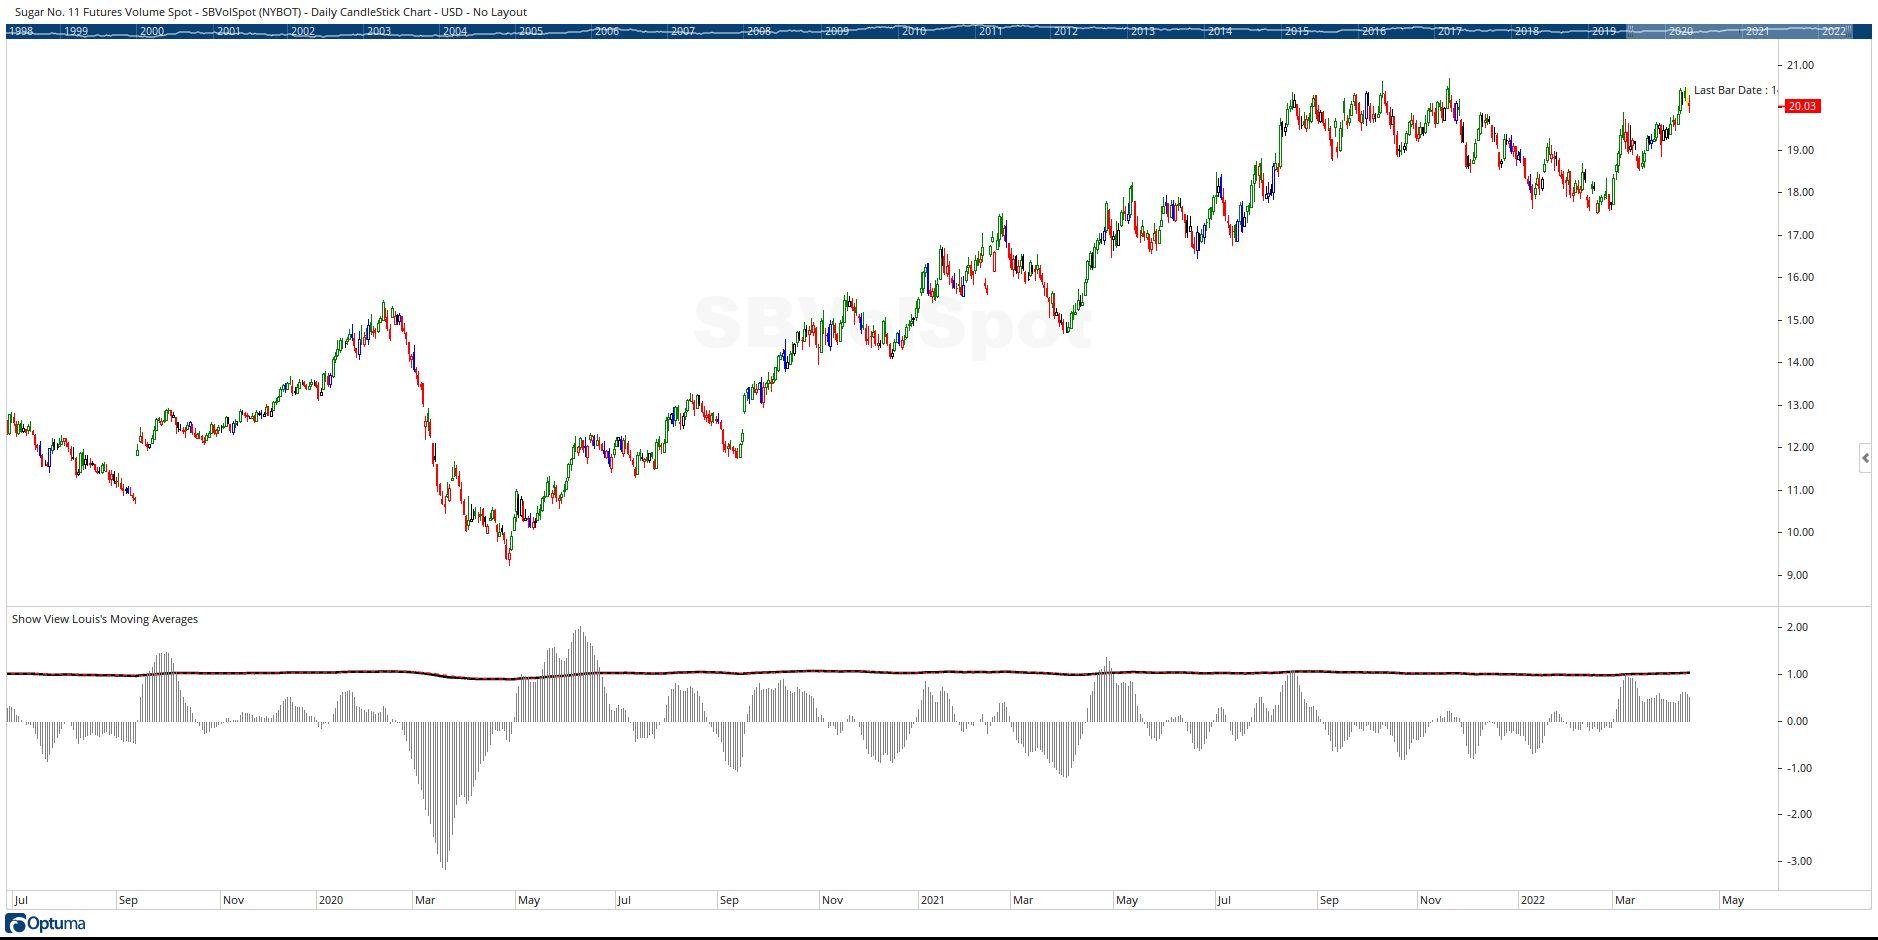
Your line Plot3 = (Plot1 - Plot2) ; is trying to subtract one array from another array. Plots are arrays and that doesn’t work. You need to do the subtraction on the creation of Plot3:
Plot3 = (MA1 / MA2) - (MA(Plot1, BARS=9, CALC=Close, STYLE=Exponential) );
Note that the values for Plot 3 are very small compared to Plot1 and Plot2, so to see the values all on one view you would need to multiply Plot3 by some factor, say 100, like this:
Plot3 = ((MA1 / MA2) - (MA(Plot1, BARS=9, CALC=Close, STYLE=Exponential) ) )* 100;
which will produce the result shown in the following screenshot:
Cheers
Trevor
Thanks for letting me know. I want this think to look like a MACD, or PPO, or KST. The only difference in my formula I am doing a division to calculate plot 1 instead of subtraction or addition. Your solution does not allow plots 1 and 2 to be see as they are in picture 1 above. Any ideas?
Hi Louis,
See if this code results in what you are looking for:
//Calculate Moving Averages
MA1 = MA(BARS=21, STYLE=Exponential, CALC=Close);
MA2 = MA(BARS=63, CALC=Close, STYLE=Exponential);
//Calculate Output Plots
//Plot1 = (MA1 / MA2);
Plot1 = (MA1 / MA2) - 1;
Plot2 = MA(Plot1, BARS=9, CALC=Close, STYLE=Exponential);
//Plot3 = (Plot1 - Plot2);
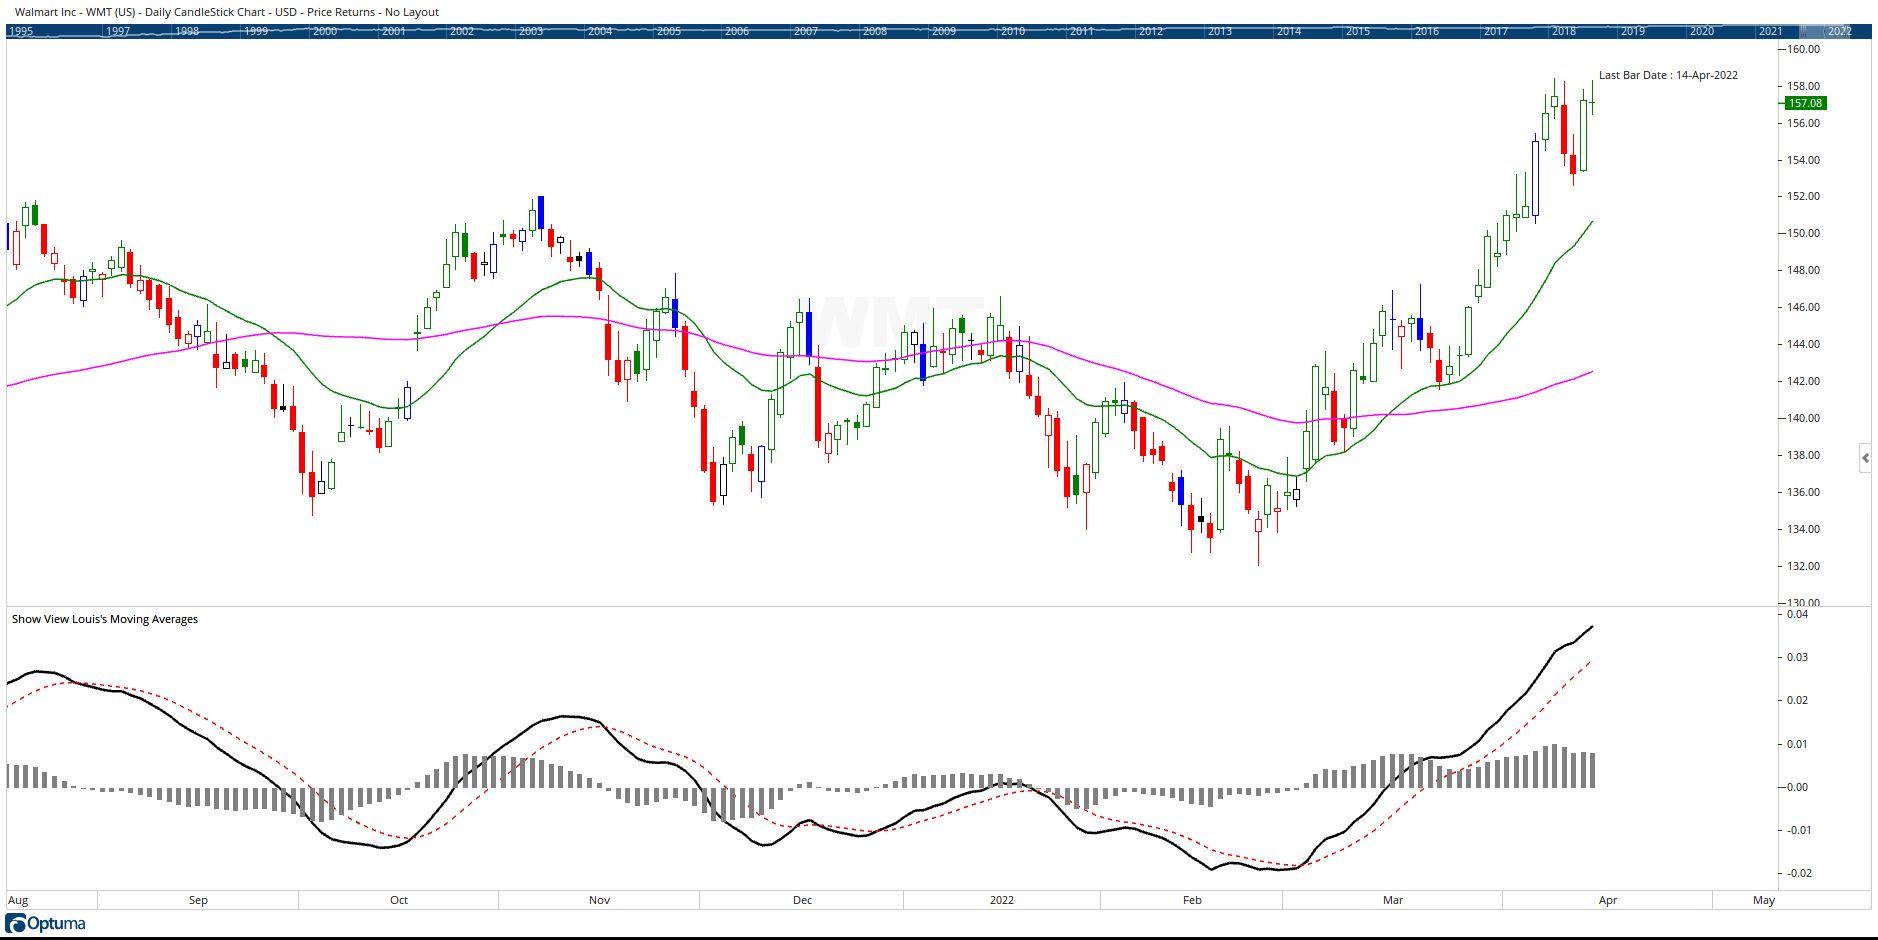
Plot3 = ((MA1 / MA2 ) - 1) - (MA(Plot1, BARS=9, CALC=Close, STYLE=Exponential));
//Define Output Plots
Plot1.Linestyle = Solid;
Plot1.Color = Black;
Plot1.LineWidth = 2;
Plot2.Linestyle = Dash;
Plot2.Color = Red;
Plot3.Plotstyle = Histogram;
Plot3.Color = Gray;
This is what is gives me:
Cheers
Trevor
Hi Trevor. You nailed it! I was trying to multiply plot3, but your approach of subtracting 1 from plot1 was a great idea! Thank you so much.