Puetz Window

Hi all

I’m looking to recreate and research further the work of Steve Puetz.

Puetz attempted to discover if eclipses and market crashes were somehow connected. Puetz conclude that a full moon in general and a lunar (eclipse) full moon close to solar eclipses, in particular, seem to be the triggering device that allows for the rapid transformation of investor psychology from manic greed to paranoia. He asks what the odds are that eight of the greatest market crashes in history would accidentally fall within a time period of six days before to three days after a full moon that occurred within six weeks of a solar eclipse?

I felt that the following would identify the necessary eclipses but it doesn’t appear to work, any thoughts?

ECL(ECLIPSE=Lunar) and [ECL(ECLIPSE=Solar) in LAST(Week(PERIODAMOUNT=6))]

Once working if this was assigned to a variable PE for example, what would be the best way to shade six days prior to and three days after PE ?

Look forward to any ideas.

Cheers

Andrew

Hi Andrew,

If i am reading the original description correctly, you are wanting to find any instance where a Full moon occurs within 6 weeks of a Solar Eclipse, then highlight a region 6 days before the full Moon and 3 days after?

If my interpretation of your request is correct the following script will work:

V1 = ECL() ;
V2 = TIMESINCESIGNAL(V1, UNIT=Weeks); 
V3 = MOON(ASPECTS=[Full Moon]);
V4 = V2 <=  6 and V3;
V5 = OFFSET(V4, OFFSET=-6) ;
V6 = TIMESINCESIGNAL(v5, UNIT=Bars) <=9;
V6

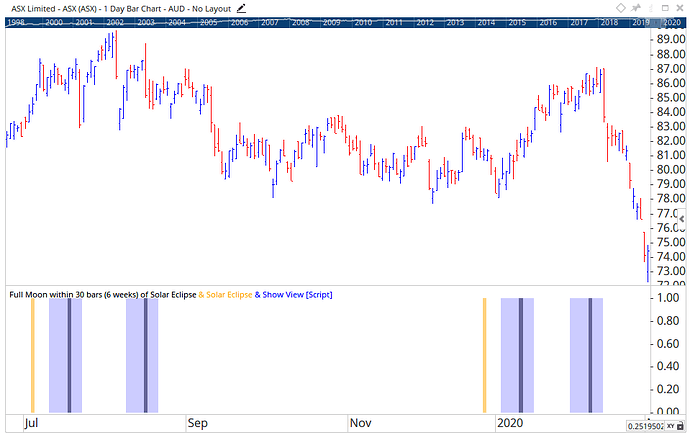
Here’s the results on a chart:

Note: This is 3 Show Views merged into one. One (orange) shows the Solar Eclipse, One (Black) the Full Moon within 6 weeks, and lastly (light blue) for the orb 6 days before and 3 days after the Full Moon.

Example Workbook Attached

AndrewScript.owb (12.3 KB)

Bravo, very helpful Matthew as was post #48071 by Darren.

Puetz went on to state that the greatest number of crashes start after the first full moon after a SE when the full moon is also a LE. Therefore I have for completeness confirmed that the following script highlights that result.

// Define the Solar Eclipse
V1 = ECL(ECLIPSE=Solar) ;
// Define the Lunar Eclipse
V2 = ECL(ECLIPSE=Lunar);
// Define the time period during which to locate the signal
V3 = TIMESINCESIGNAL(V1, UNIT=Weeks); 
// Signal requires SE in last six weeks AND a LE
V4 = V3 <=  6 and V2;
// Apply a 6day offset to any signal bar
V5 = OFFSET(V4, OFFSET=-6) ;
// Add nine days to the offset  to give 6days prior + 3days post signal bar
V6 = TIMESINCESIGNAL(v5, UNIT=Bars) <=9;
// Display signal window
V6

Note that the script is not highlighting FUTURE occurrences of the “Puetz window”, an example being the upcoming LE on 5 July 2020. Is there a way to display such future occurances?

Cheers

Andrew

Hi Andrew,

my congratulation for your fine work about the “Puetz Window”. I use the Solar and Lunar Eclipses since a while as a great intermediate-term trend reversal signal.

What you can add to your “Puetz Window” is the Sun/North Node Square. It is exact in the middle of the eclipses season. The tool to do this is the Planetary Aspect tool. See my screenshots for the settings.

screen shot-01

screen shot-04

Concerning your question about displaying future dates. You can simple use the Eclipse and Moon Phases tools to display future dates. What is of course missing is the window/orb around the full moon after the solar eclipse. But that can be accepted.

Thanks for sharing your great idea.

Thomas

Thanks Thomas, I always like to post an end result in case it offers someone else inspiration at some point in the future.

I look at all 90* aspects of sun node and then also moon node also for some rather nice shorter term info.

I’d still be interested in a response from the moderators re why the script doesn’t pick up future occurrences? Clearly Optuma allows us to label future eclipses so I just don’t understand why the script wouldn’t highlight Puetz windows using the script also?


Hi Andrew,

Most astro scripts can plot past the last bar. If just the Eclipse function were being used, the Show View would display past the last bar. However this is due to special rules coded into the Show View on how to handle Astro items, which have data into the future.

This same rule doesn’t apply for the TimeSinceSignal() function, and as this is being used in the script for the final output, the Show View does not allow it to display results past the last bar.

I’ll discuss with the developers if this is something that maybe adjusted in a future build of Optuma.

Hi Andrew,

We were able to sneak this change into the Optuma v1.6 update which is currently in Alpha. Here’s a screen shot for the version i’m currently testing using your script:

Ex8

You can see the script can project into the future now.

We’re aiming for this version to be available as a beta download by the end of this month.


Fantastic news, well done Team Optuma !!

I’m pretty excited by the changes in v1.6 that Mathew outlined recently when updating Alan Oliver’s TWG group, this is just another bonus.

Please thank all involved.

Hi,

I try to make some changes to the Puetz window but am not successful.

For the Putze window I use the following script from Andrew (see above):

// Define the Solar Eclipse 
V1 = ECL(ECLIPSE=Solar, GMT=-5.00); 
// Define the Lunar Eclipse 
V2 = ECL(ECLIPSE=Lunar, GMT=-5.00); 
// Define the time period during which to locate the signal 
V3 = TIMESINCESIGNAL(V1, UNIT=Weeks); 
// Signal requires SE in last six weeks AND a LE 
V4 = V3 <= 6 and V2; 
// Apply a 6 day offset to any signal bar 
V5 = OFFSET(V4, OFFSET=-6); 
// Add nine days to the offset to give 6 days prior + 3 days post signal bar 
V6 = TIMESINCESIGNAL(V5, UNIT=Bars) <=9; 
// Display signal window 
V6

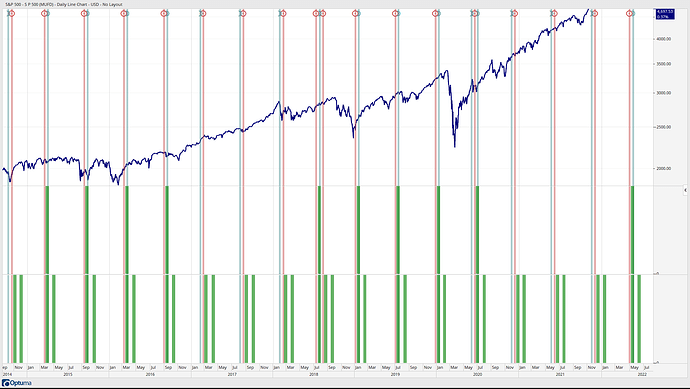
That script works fine. The Puetz window are the green bars in the middle window of my screenshot.

I have tried to add the SECOND full moon that follows a solar eclipse when the first full moon AFTER the solar eclipse was also a lunar eclipse.

I have tried a lot of script variations but completely failed. Here is one of my script trials:

// Define the Solar Eclipse 
V1 = ECL(ECLIPSE=Solar, GMT=-5.00); 
// Define the Full Moon 
V2 = MOON(ASPECTS=[Full Moon], GMT=-5.00); 
// Define the time period during which to locate the signal 
V3 = TIMESINCESIGNAL(V1, UNIT=Weeks); 
// Signal requires SE in last six weeks AND a Full Moon 
V4 = V3 <= 6 and V2; 
// Apply a 6day offset to any signal bar 
V5 = OFFSET(V4, OFFSET=-6); 
// Add nine days to the offset to give 6 days prior + 3 days post signal bar 
V6 = TIMESINCESIGNAL(V5, UNIT=Bars) <=9; 
// Display signal window 
V6

The script works but it is not what I am looking for. As you can see from the screenshot the full moons (green bars in lower window) are also drawn when there is NO Puetz window e.g. in 2017 and early 2018.

To repeat what I am looking for:
I want draw bars when there is a Puetz window (see first script above) AND bars for the SECOND full moon that follows a solar eclipse when the first full moon after the solar eclipse was also a lunar eclipse.

My second script draws green bars for the second full moon after a solar eclipse BUT it draws also green bars when there is NO Puetz window. A Puetz window requires a full moon that is also a lunar eclipse AFTER a solar eclipse.

Thanks and best wishes,
Thomas