Hi,
I’m attempting to create a script for the scanner that identifies any stock where the prior day’s price range crossed the lower Bollinger Band (21 bar, exponential), but closed above the lower Bollinger Band. I’m new to the scripts, so to begin, I used SHOWBAR to test what I was doing. The script I used to identify the cross, is as follows:
LOW() CrossesBelow BB(DEFAULT=LowerLine, BARS=21, STYLE=Exponential) – these are identified as green arrows in the image below
The script I used to identify the close, is as follows:
CLOSE() > BB(DEFAULT=LowerLine, BARS=21, STYLE=Exponential) – identified by the fuchsia arrows below
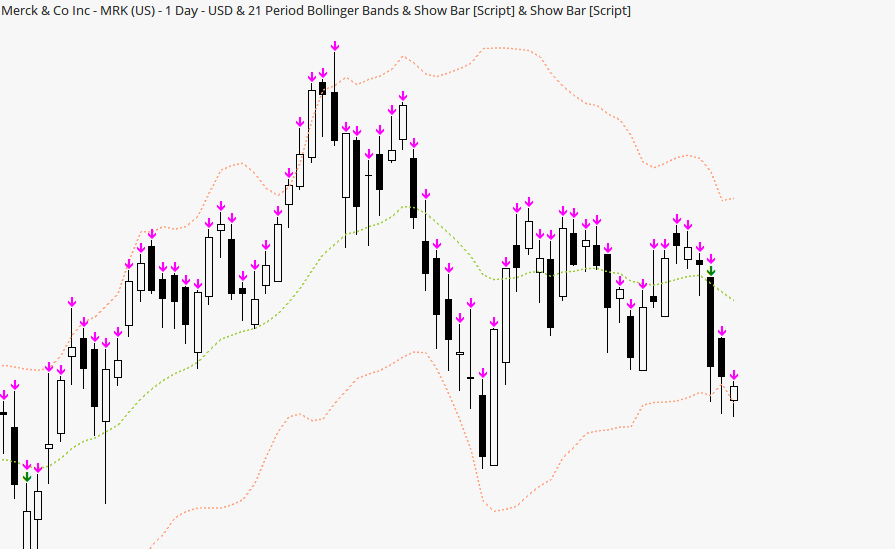
As you can see above, the last black candle on the right does not indicate a green arrow, but the candle range from that day opened above, crossed below, and then closed above. The script for the "close above" SHOWBAR appears to work as expected. This is one example, but there are many, where it doesn’t quite make sense. By the way, the properties for the Bollingers on the chart above are identical to what is in the script (21 day, Exponential, Close).
Once I have this step correct, I’ll put it into a script with an OFFSET = 1 to scan for the prior day. At least, I think that’s the correct way to do it ?.
What am I doing wrong?
Thanks.
