Simple - it’s very much like a RSI, but RMI. Would love to see this feature as it’s the only indicator I use consistently. It count the same way except from N days ago.
Hi Matthew,
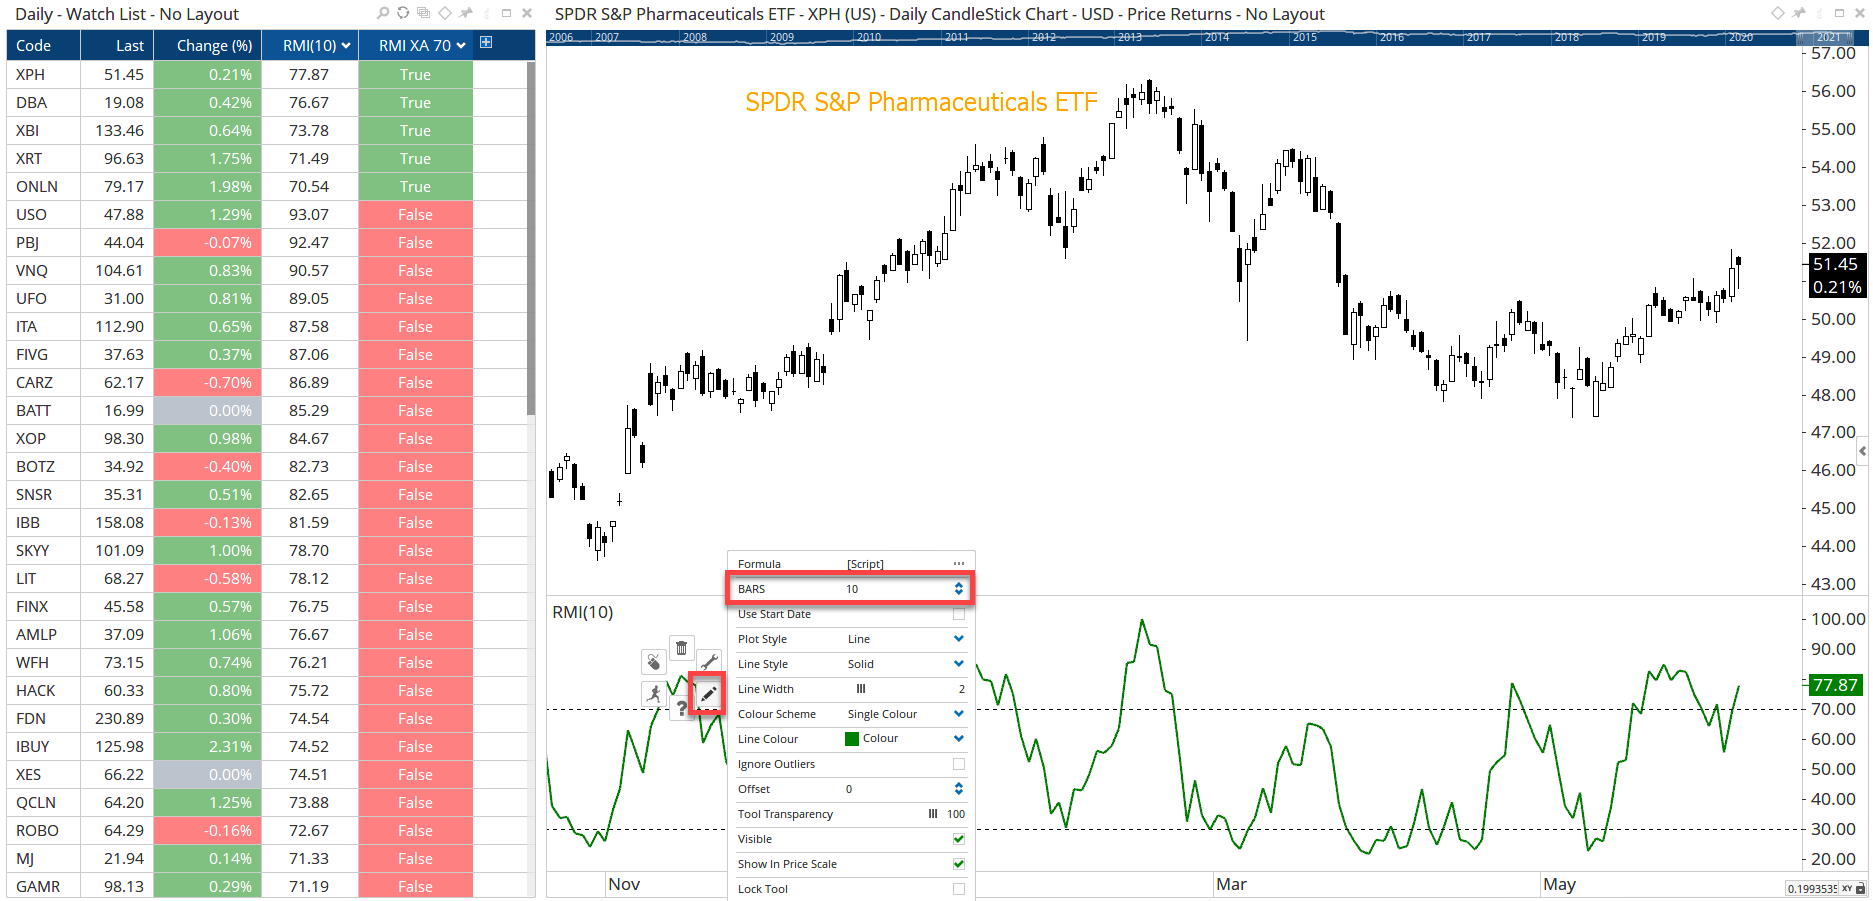
I found a formula and created the following script in a Show View (one applied change the BARS option in the properties to change the lookback period from 10 days).
//Set Lookback period;
#$BARS=10;
//Get directional change values;
U1 = IF(CHANGE() > 0, CLOSE()-CLOSE(1), 0);
D1 = IF(CHANGE() <=0, ABS(CLOSE()-CLOSE(1)),0);
//Sum changes over lookback period;
U2 = ACC(U1, BARS=$BARS, RANGE=Look Back Period);
D2 = ACC(D1, BARS=$BARS, RANGE=Look Back Period);
//Calculate RMI;
RMI = 100 * (U2 / (U2+D2));
RMI
When made into a Boolean true/false condition (eg RMI CrossesAbove 70) then it can be used in a watchlist or scan. Workbook attached.
RMI.owb (65.1 KB)
Thanks, Darren! I’ll play around with it to create a signal line for crossover screens. Appreciate that you did this as I’ve been having trouble finding a way to screen for RMI signals.
No worries. Would you use a moving average as the signal line? So for a cross above its 50MA change the last line to this:
RMI CrossesAbove MA(RMI, BARS=50)
Appreciate it! This should do the trick.