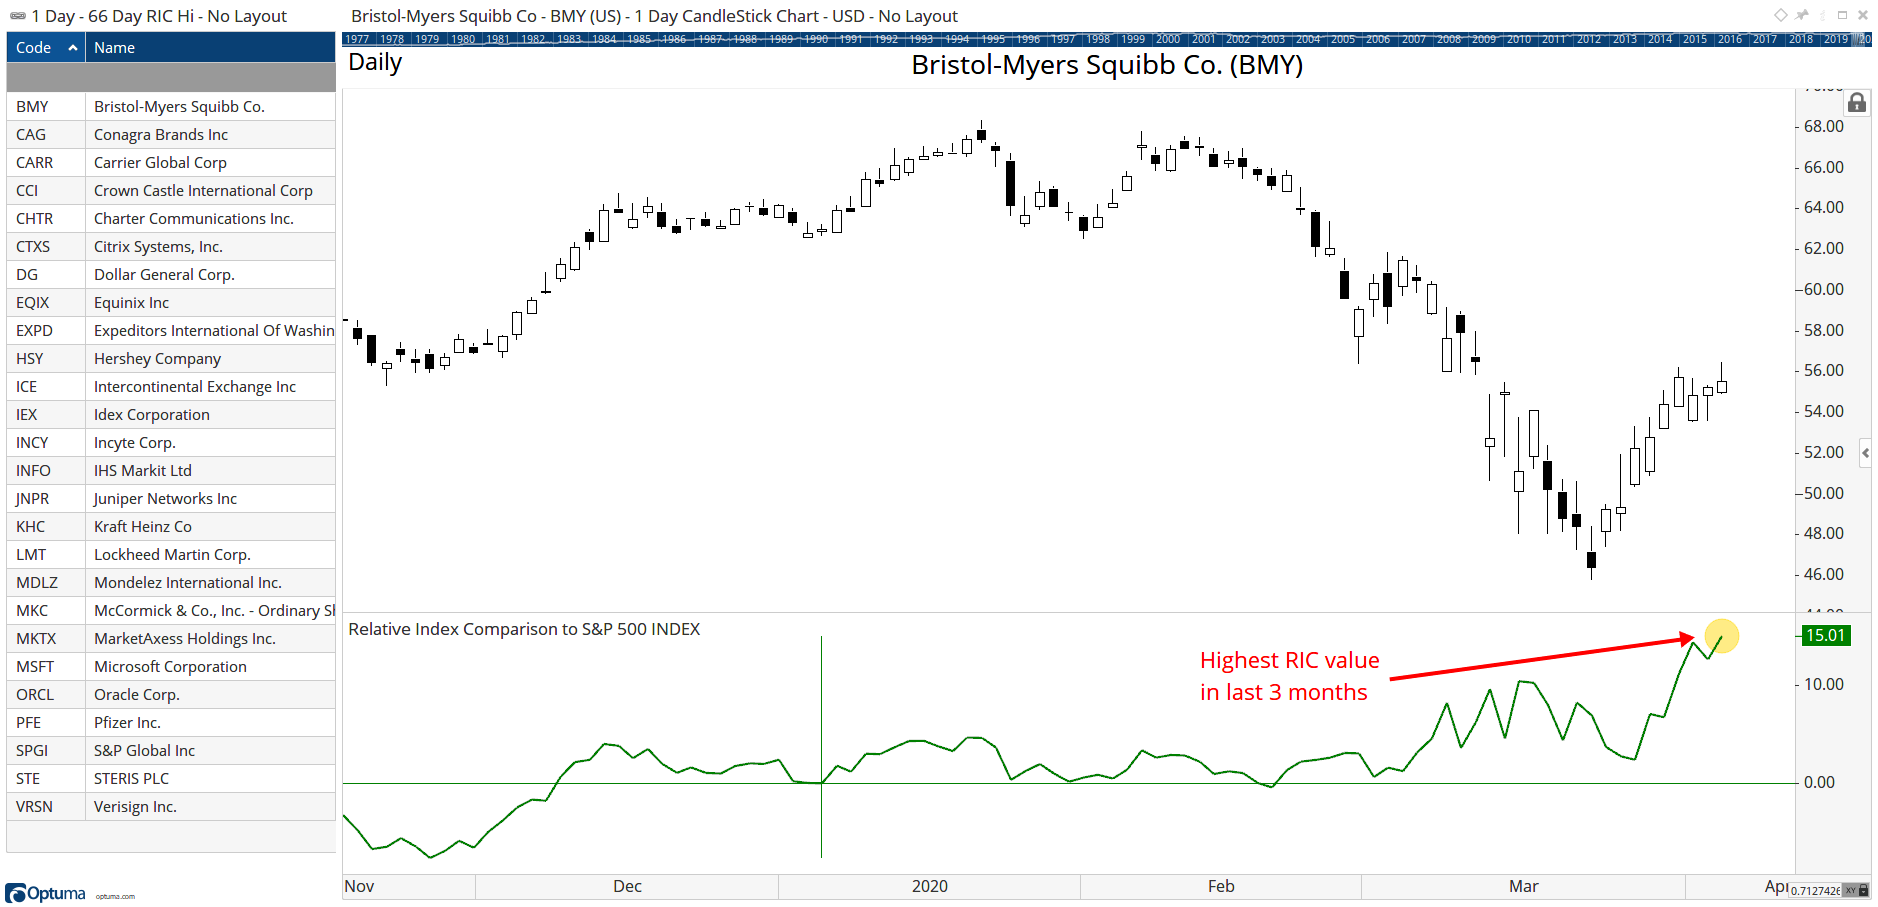
The Relative Index Comparison function RIC() was used in this tweet to scan for new relative 3 month highs in the S&P500 using the following script in a scan (change the comparison index to that of your market, eg XJO for Australia, FTSE for the UK, or NIFTY for India).
//Get relative value - RIC
R1=RIC(DATESEL=Last Year, INDEX=SPX:WI);
C1=CLOSE(R1);
// Get highest RIC for last 3 months;
H1 = HIGHESTHIGH(C1, BARS=3, BACKTYPE=Months);
//Is latest RIC > last 3 months?
R1 > H1
When the RIC tool is placed on the chart it will be at its highest point over the last 3 months:
To link a watchlist to a scan and so that it automatically updates see this short video:
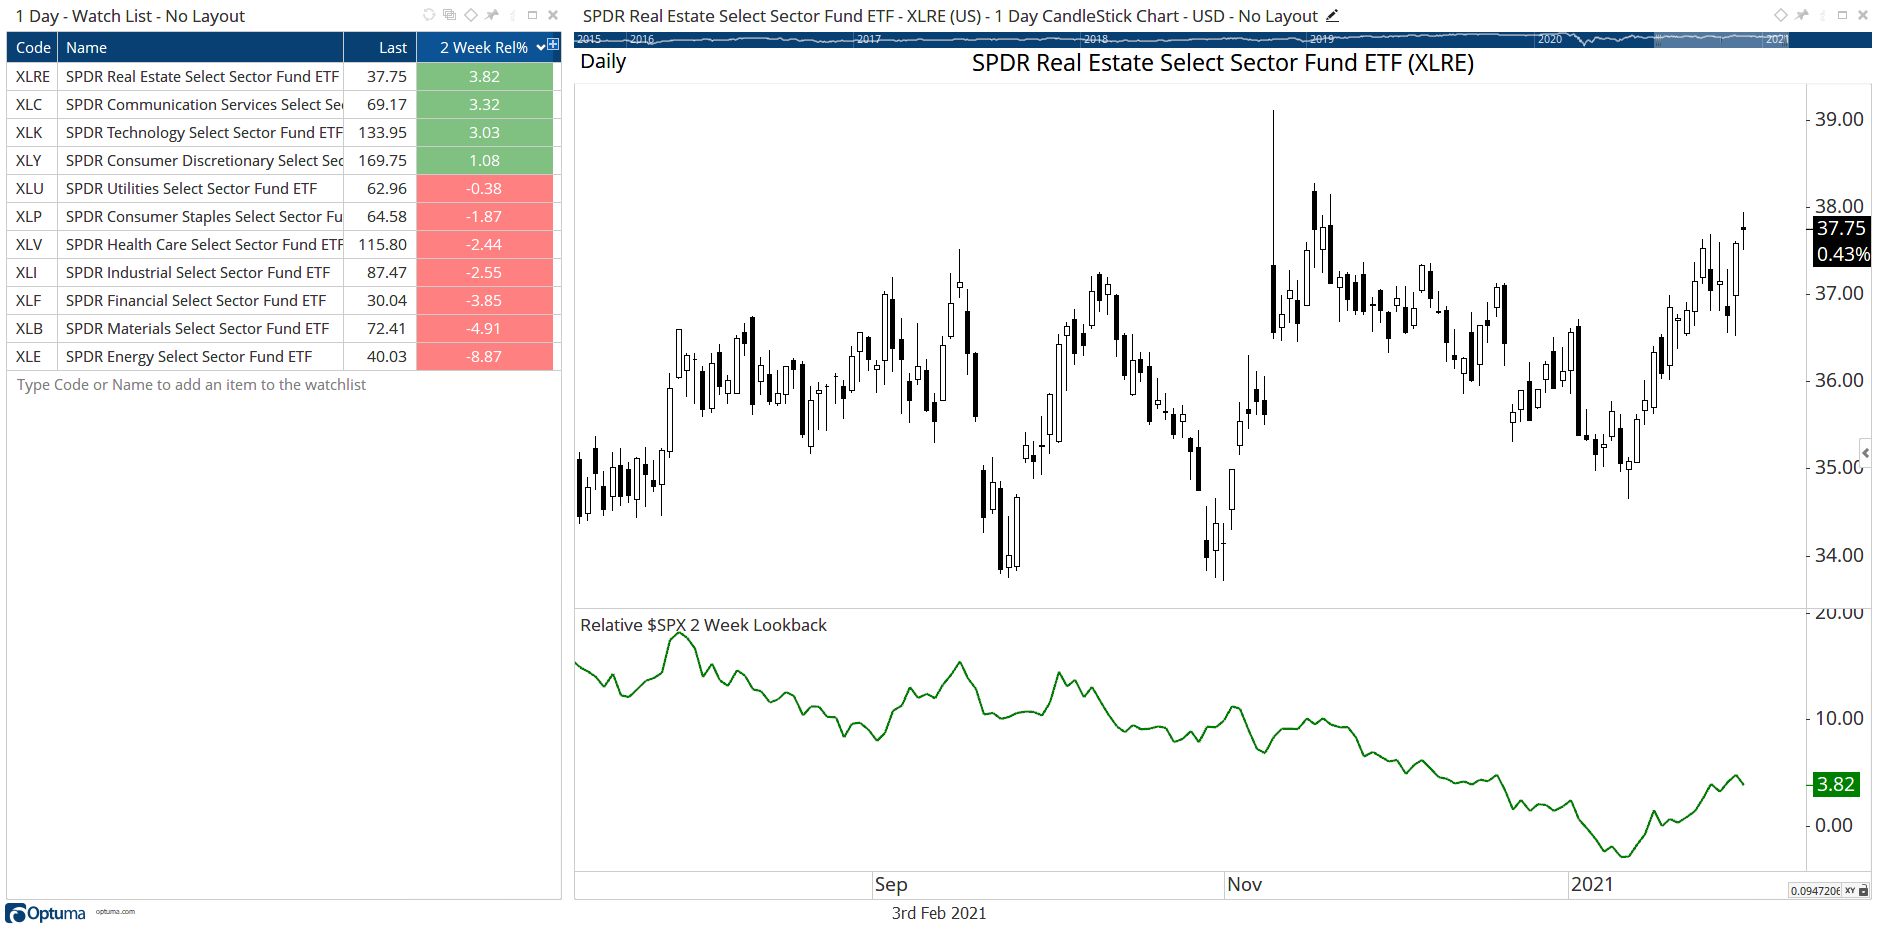
Thanks Deepak. The column in the tweet is a different measure and a different formula - it’s the performance relative to the SPX over the last 3 months:
To change the RIC() lookback periods to something other than the default Last Month, Last Quarter, etc you can use this trick to set to something else.
The first line finds the date 10 bars ago (2 trading weeks) which is then used in the second line for the Start_Date= field.
You can use this script to build options for all the different time frames you were after by adjusting the value on the first line. So for 6 weeks you’d use a 30 bar (6 x 5 trading days) offset:
$A = BARDATE()[30];
The script can then be used in a Show View tool or Watchlist column: