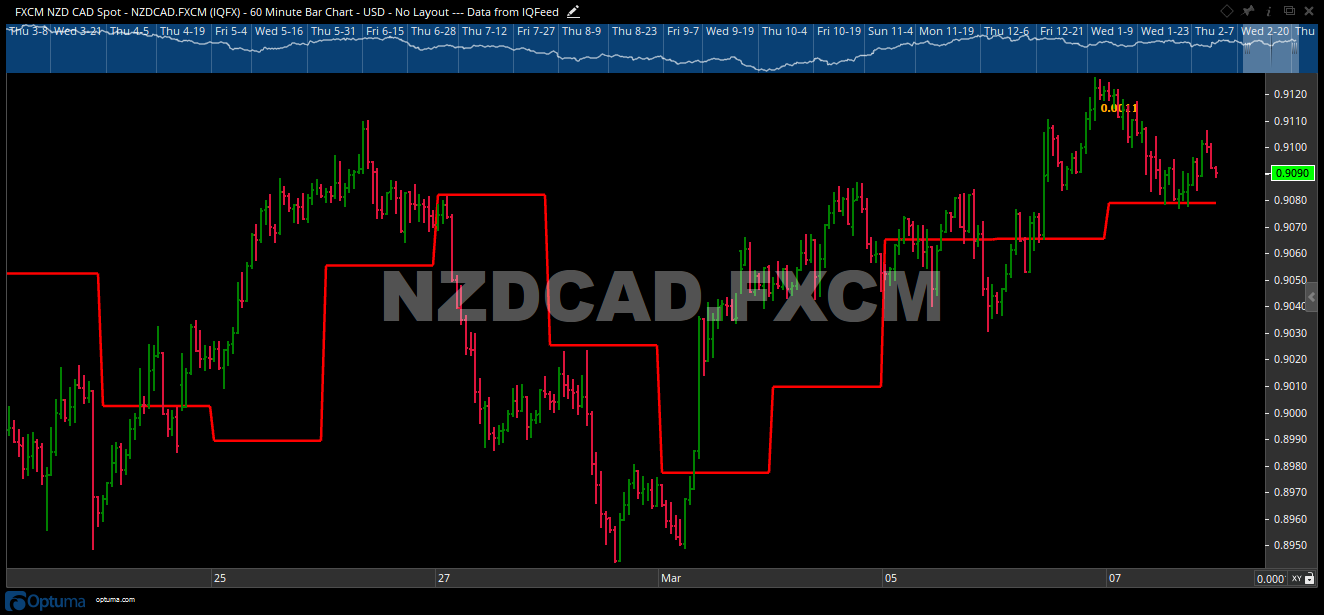
I am using the PIVOTS function to apply daily pivots to my chart. (See attached example).
Script is simply:
PIVOTS()
Is it possible to remove or hide the vertical component of these lines? It would improve clarity on my screen, particularly when other indicators are added.
You can adjust the Show Plot script tool properties to a Dot plot style instead of Line. When this is done increase the thickness to form a solid line (not the value will change depending on zoom level and size of the chart).
This will show just the horizontal components of the script results.
If you have the script applied to a yearly chart it will automatically use that time frame to calculate from. If you mean the tools properties itself, we do not have a yearly calc option, Monthly Pivots is as high as the tool allows.
Thanks. Is there any sort of work around this? (I would like to apply yearly pivots to a daily chart).
I've been able to do similar in other scripts using PERIODAMOUNT - ie applying a 6 monthly indicator to a monthly chart by using PERIODAMOUNT=6 but I can't see this as an option for PIVOTS
Just following up on this. Is there a workaround to allow me to obtain yearly pivots using the PIVOTS function? (using perhaps PERIODAMOUNT or similar?)
Thanks Darren. It's not the yearly high/lows that I'm looking for - but rather pivot points. (eg https://www.babypips.com/learn/forex/how-to-calculate-pivot-points)
The tool "Pivots" gets me close to what I want however there are a couple of things it doesn't do:
Yearly pivots. (Currently the tool only allows for daily, weekly or monthly pivots). Can yearly pivots please be added to these options?
Vertical lines. As the Pivots tool is plotted, there are (vertical) lines joining or connecting the horizontal pivot levels that I would like to remove.
I'll attach an image with the parts of the pivot levels that I would like to hide or remove circled. I have a script that does essentially the same job as the Pivots tool however when I select dots (for plotstyle) the vertical component is hidden. It's not a big thing - but would give some more clarity to my charts. And of course, only daily, weekly or monthly pivots are given as options. Again - would appreciate it if yearly pivots could be added as an option here.