I want to shade a chart wherever there has been a % rise or fall in price over time (like areas identified manually below except shading over full view).
Lets say I want to identify all periods in DJI history where the market has corrected > 50% over a 3 year period.
I’ve have been working with the scripting below without the result I expect. Would it be possible to capture a rise and then further 50% fall in the same 3 year period if it were to occur or does that require the grunt of pascal programming…?
Think about this as two scripts which are combined in a SWITCH function. Then you need to think about the conditions to turn on the switch and the conditions to turn it off again.
In your script just make “Show” line into V3 = %D CrossesBelow -50;
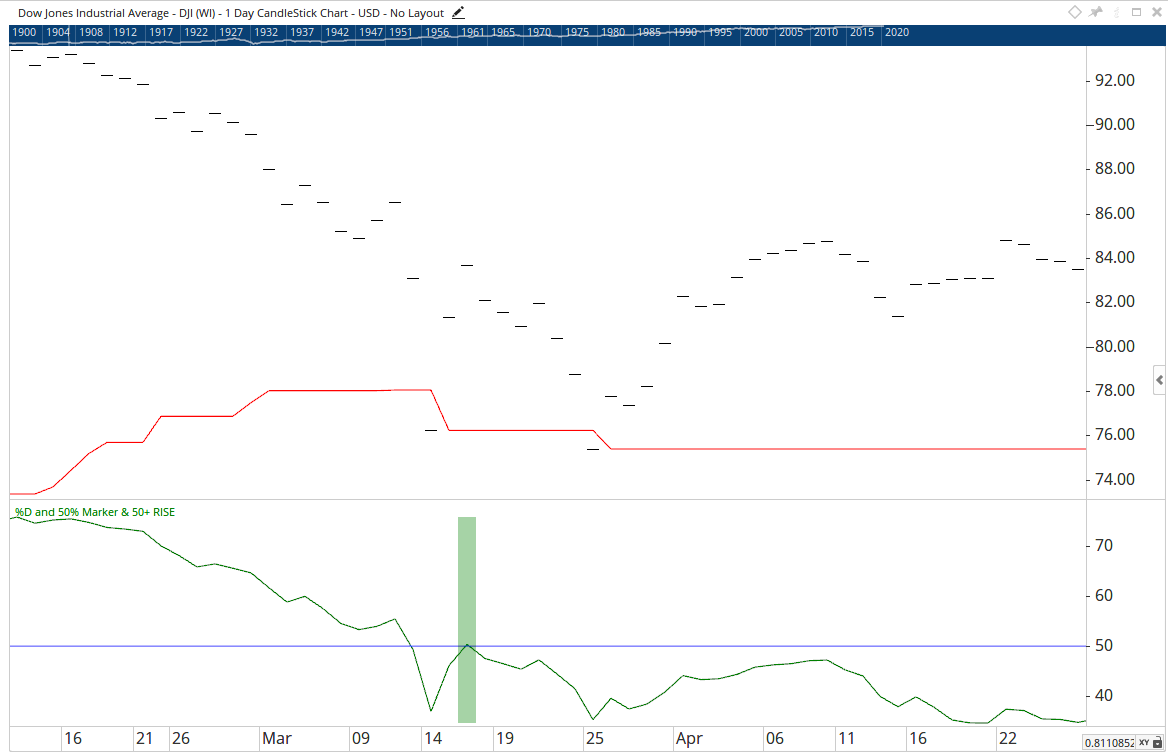
Morning guys - I’m still trying to achieve the outcome I am after with this script. Grateful if you could help me understand why the 50+RISE script in the attached workbook is signalling on 18 Mar 1907 ?
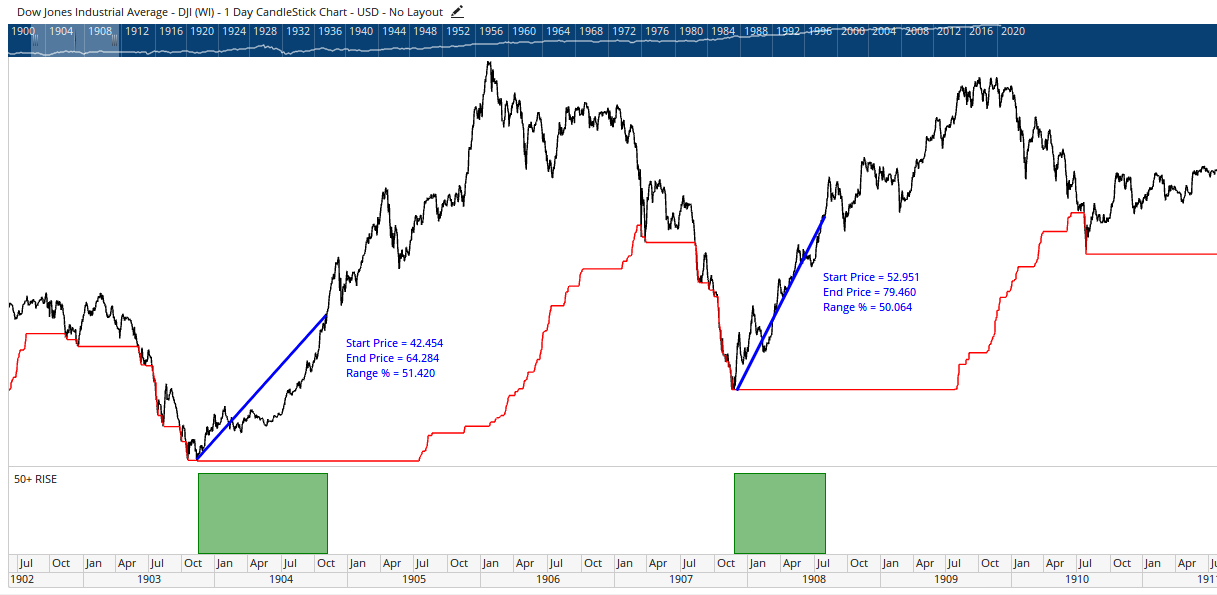
Ultimately I am looking to identify the periods where the market has increased by 50% or more from the LL for a defined period, in this script currently 3 years. I want to get to something like the image attached (50+ RISE goal).
Grateful for any assistance or more of a guide in the right direction here.
When your script is broken down to show the %D plot with a Horizontal Line at 50, you will see that on the date in question the line jumps just above 50, and so the criteria is met.