Hello,
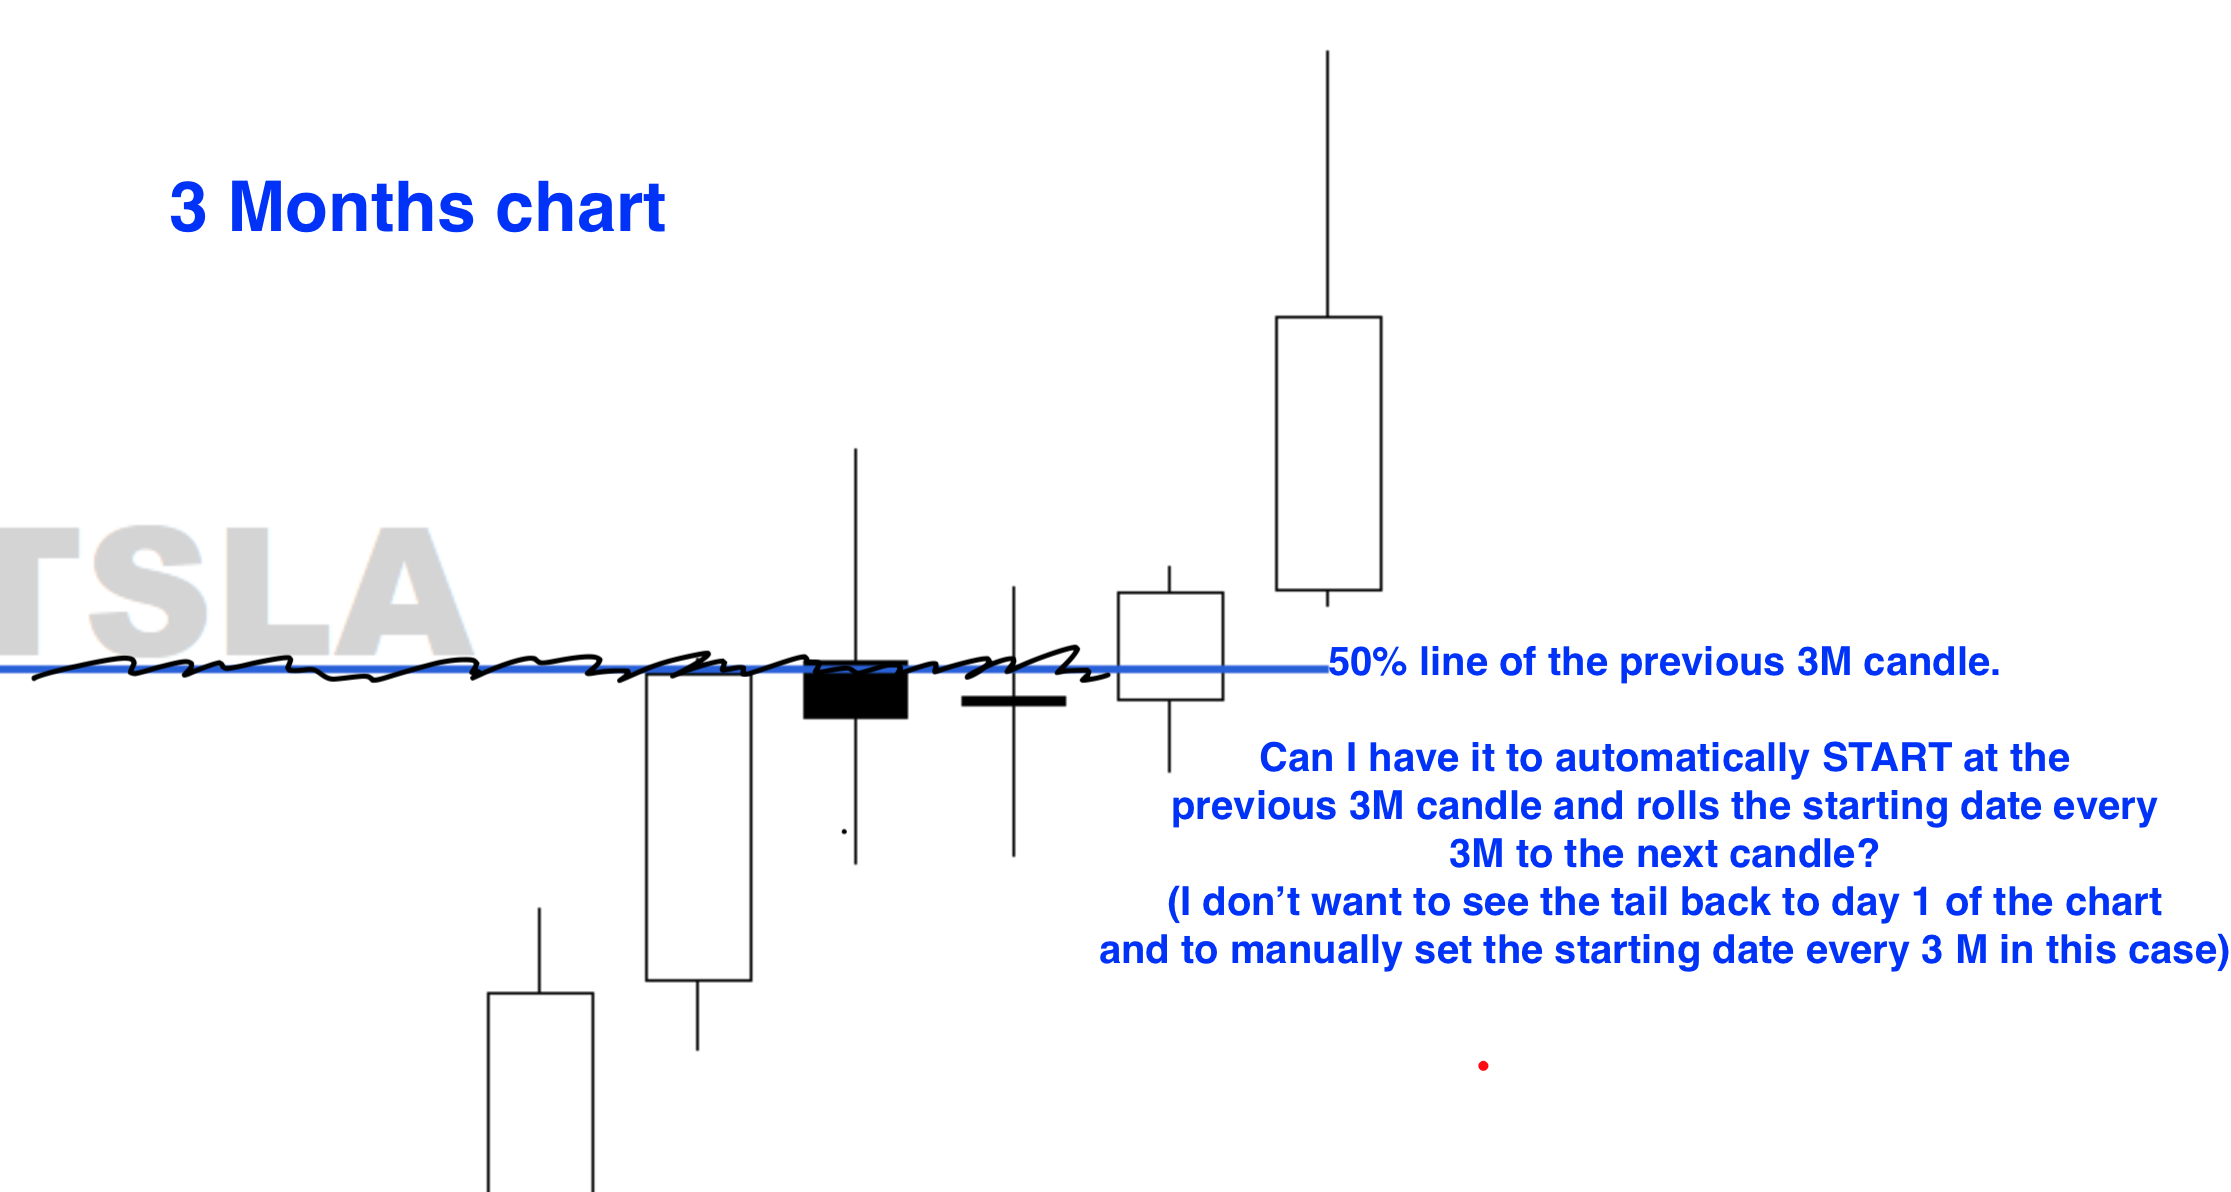
Is it possible to set a rolling starting date for a line? See example attached:
Thank you
Marc
Hello,
Is it possible to set a rolling starting date for a line? See example attached:
Thank you
Marc
Hi,
Yes, you can use a combination of BarIndex(), IF() and Hidden() functions to achieve this result.
Example:
IF(BarIndex() > Last(BarIndex(OFFSET=2)), Last((High(OFFSET=1) + Low(OFFSET=1)) / 2), Hidden())
This is how the above would look on a chart using a Show Plot:

Thanks Matthew,
How do you define the period in this case? There is no mention of 3 months period in the formula…
best
Marc
Hi,
Your example used a quarterly chart, so I did the same. BarIndex() was used to determine how far back the line should go, in your example you were starting from the bar you took the H/L average from, which was the second last bar, so I used the offset to set that.
BarIndex() > Last(BarIndex(OFFSET=2))
All bars on a chart have a bar index, you can add BARINDEX() to a Show View to see each value. This can be used as a reference to change the range in different scripts.