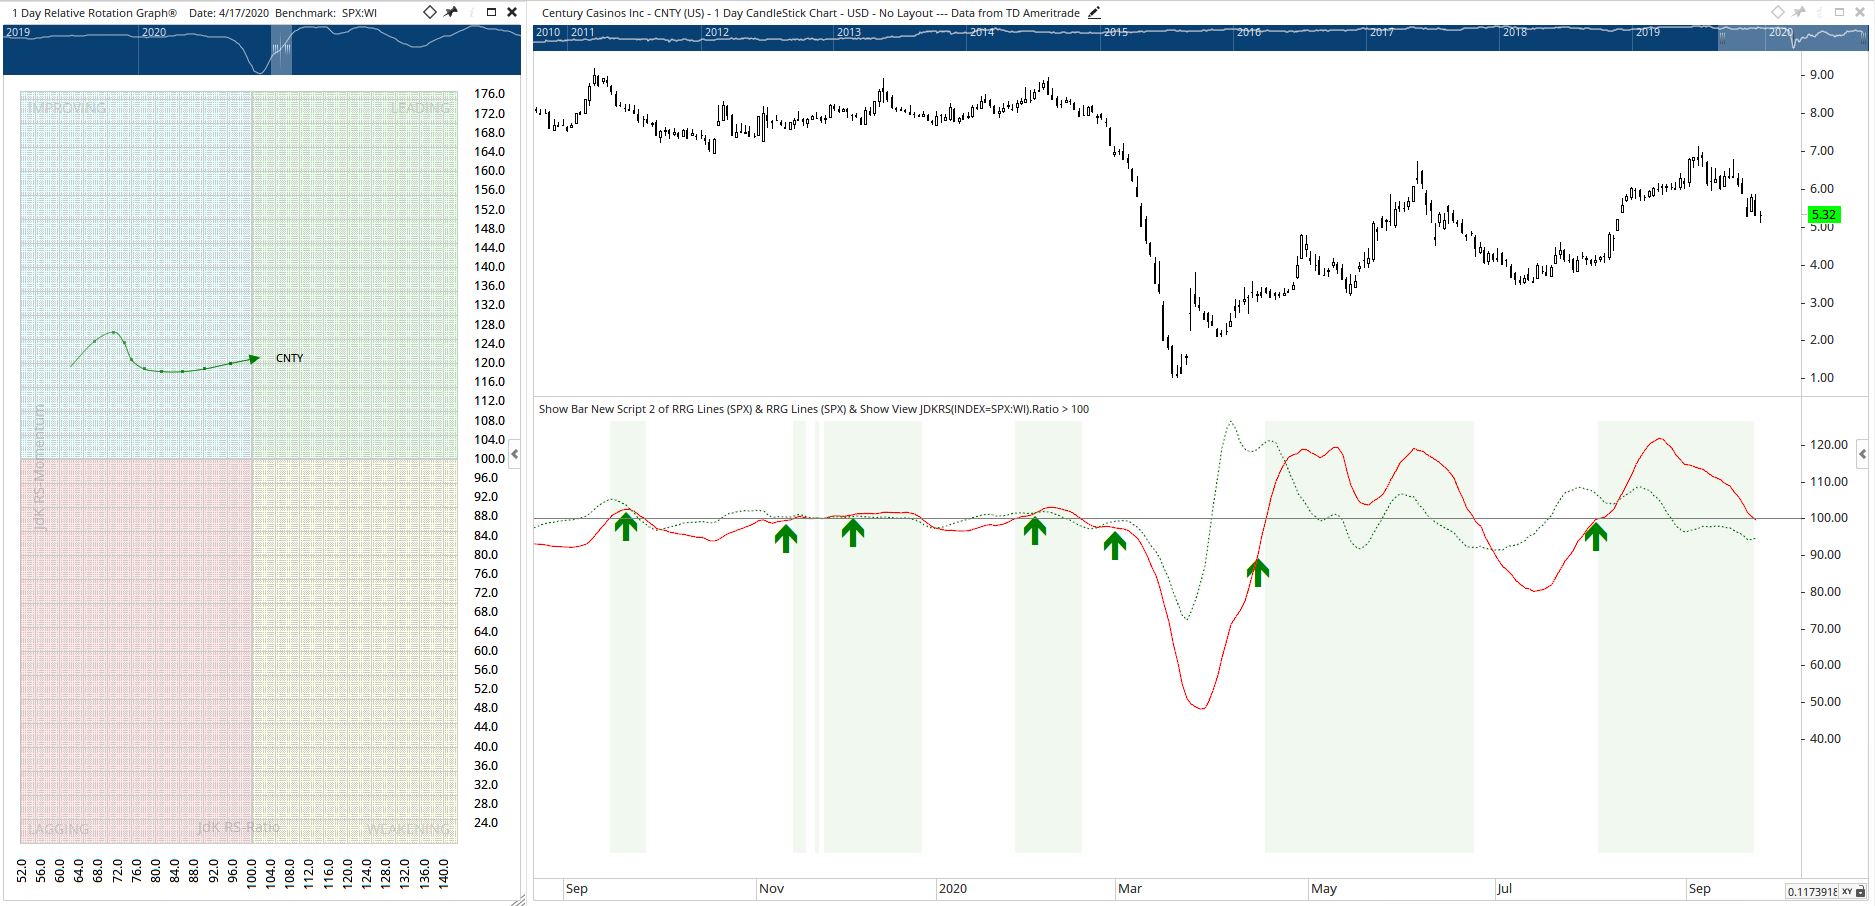
i’m working on some scripting practice and notice that i’m not getting the values that i’m looking for. In the attached i’m looking for the RRG ratio crossing above 100. i’m using the following script:
In your example the Show Bar tool has been applied directly to the RRG tool. That means it is the underlying data source the script is based off of, not the chart. The effect this has is that your current script is an RRG of an RRG, so the results don’t align.
To fix the issue there are two options. Apply the Show Bar to the chart with the current script, then drag and drop it to the RRG Lines view (the same way you did with the Show View) and it will match.
Or, apply the Show Bars directly to the RRG Lines tool and adjust the script to:
CLOSE() CrossesAbove 100
If you just want the point the line crosses above. Or…
Close() > 100
If you want an arrow anytime the line is above 100 (matching the Show View).
Once either options is done the results will match.
Thank you for the info… its the second time that i’ve done that. Love that the software is so simple once i get past these little things. have a followup question however… i’m able to replicate the chart above, but i can only get signals based on the ratio, while i’m wanting one on the dotted momentum line. i’ve messed around with it this morning (dot notation, nesting) and i’m only able to get signals on the ratio line. Any help appreciated.
When wanting to reference a plot that isn’t the main line of a multi-plot indicator like this, you’ll need to use the process outlined in my original reply where you apply the Show Bar to the chart, then drag and drop it onto the RRG window after the script has been setup.
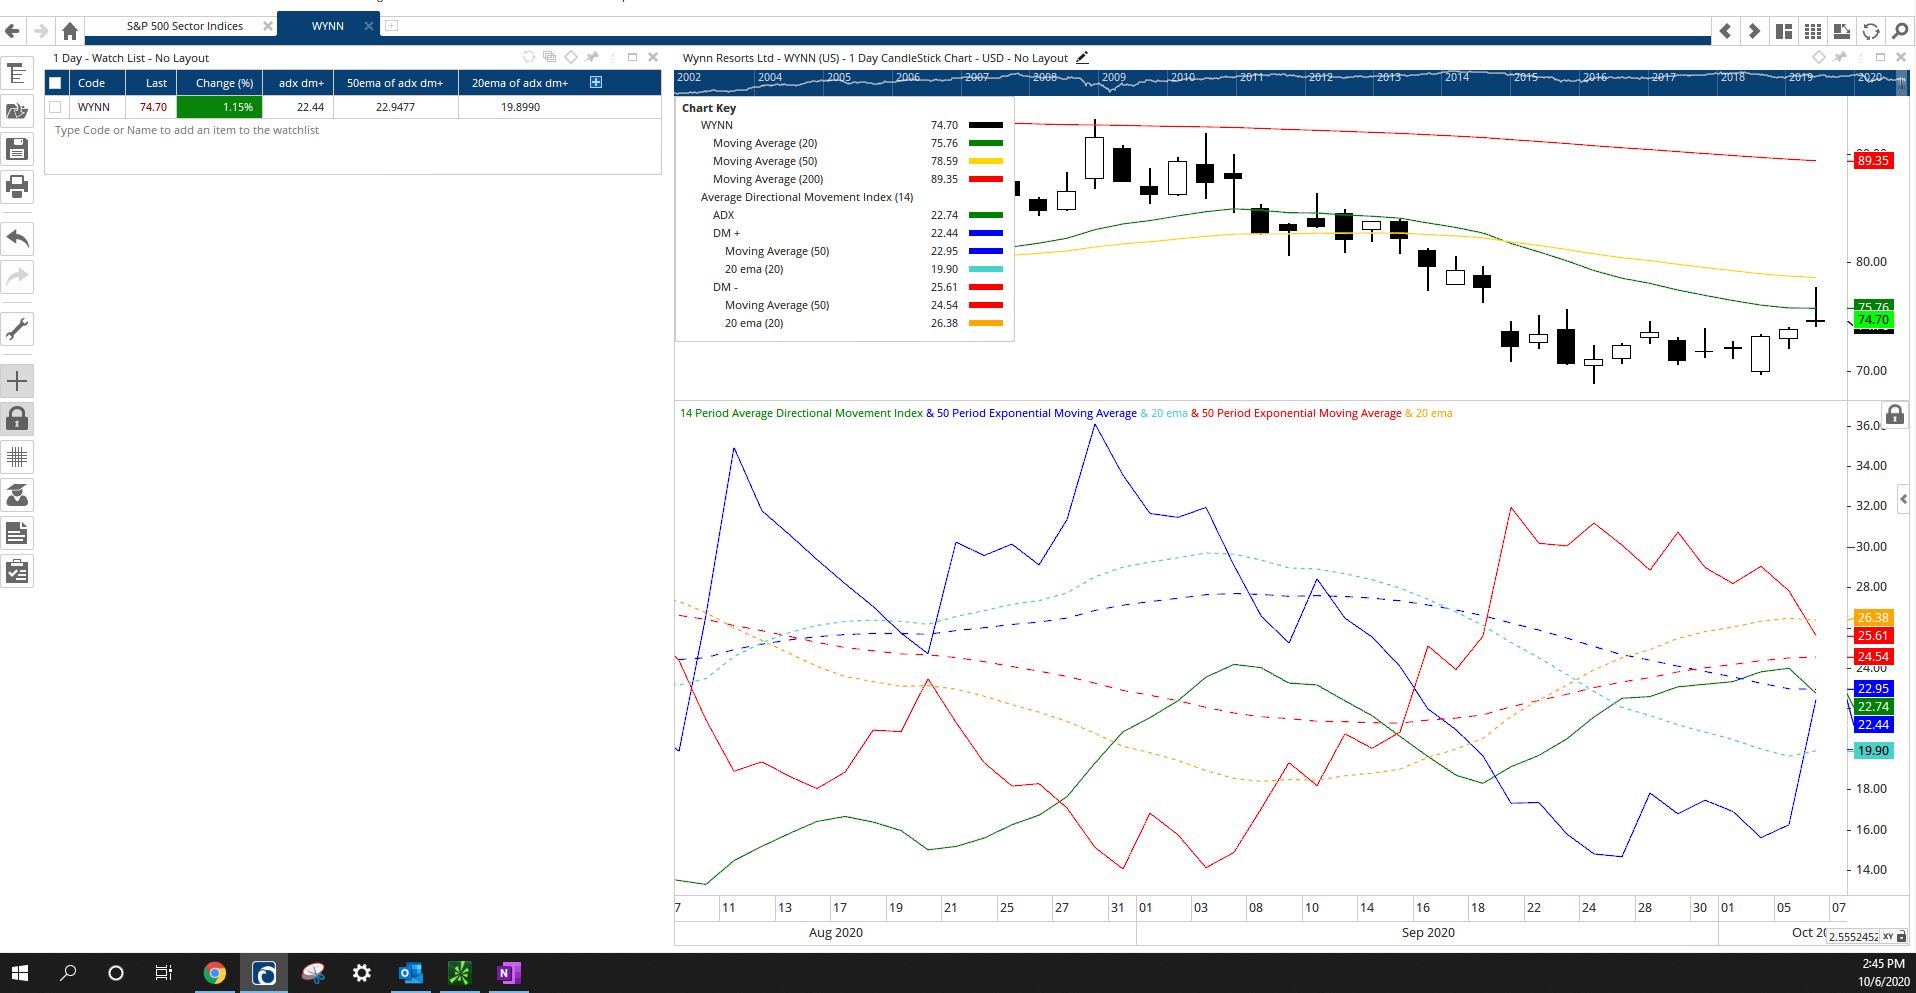
I’m back… working with the ADX indicator and am running into the same issues. i have the value calculated correctly in the watchlist, but am unable to mark the crossovers. i’ve attempted the replication of the video you posted for me and watched videos in the scripting school, but i’m not picking up the correct signal. suggestions are welcomed and appreciated.
For the Show Bar on the chart use the following (I’m not sure of what crossover you need but this is for the 20EMA of the DM+ crossing above the 50EMA of the DM+):
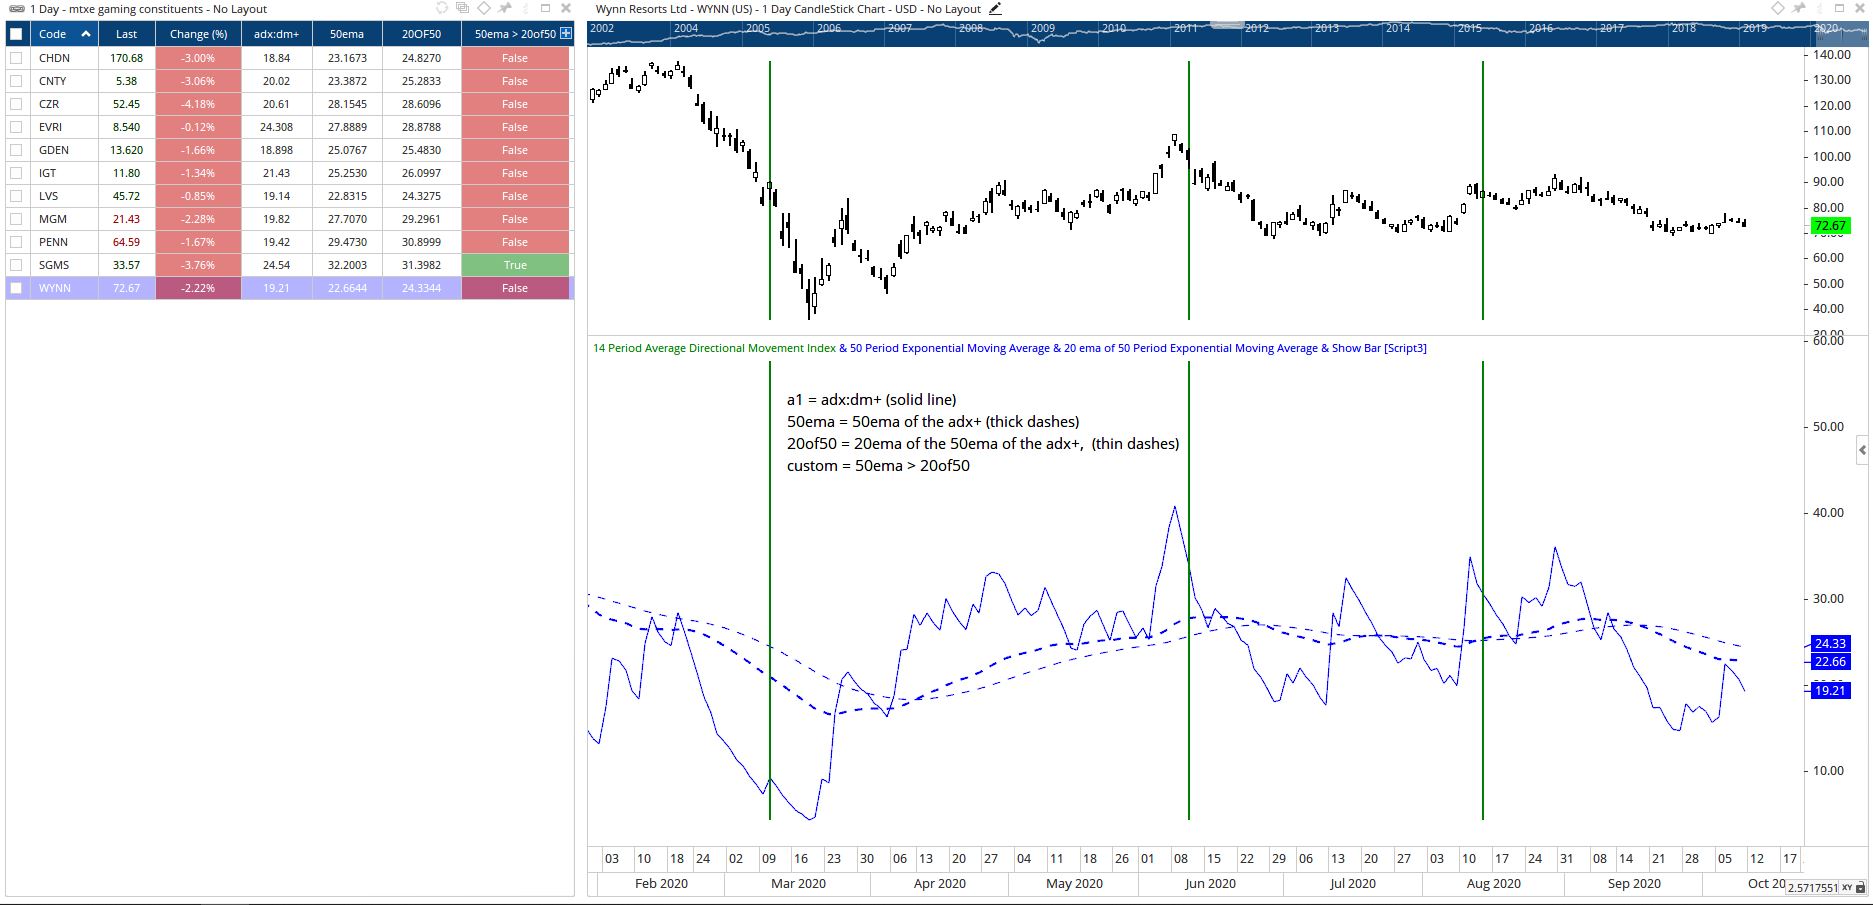
Thank you for the information! I’m still getting a bit stuck however. My intention is to obtain a signal on the adx:dm+ at the moving average crossovers below:
50ema = 50ema of the adx:dm+ (thick dashes)
20of 50 = 20ema of the 50ema of the adx:dm+ (thin dashes)
I’m able to obtain the correct information in the watchlist but not able to get the signals thru showbar. here is what i have:
// signal when the 50ema of ADX:DM+ crosses above the 20ema of 50ema of ADX:DM+
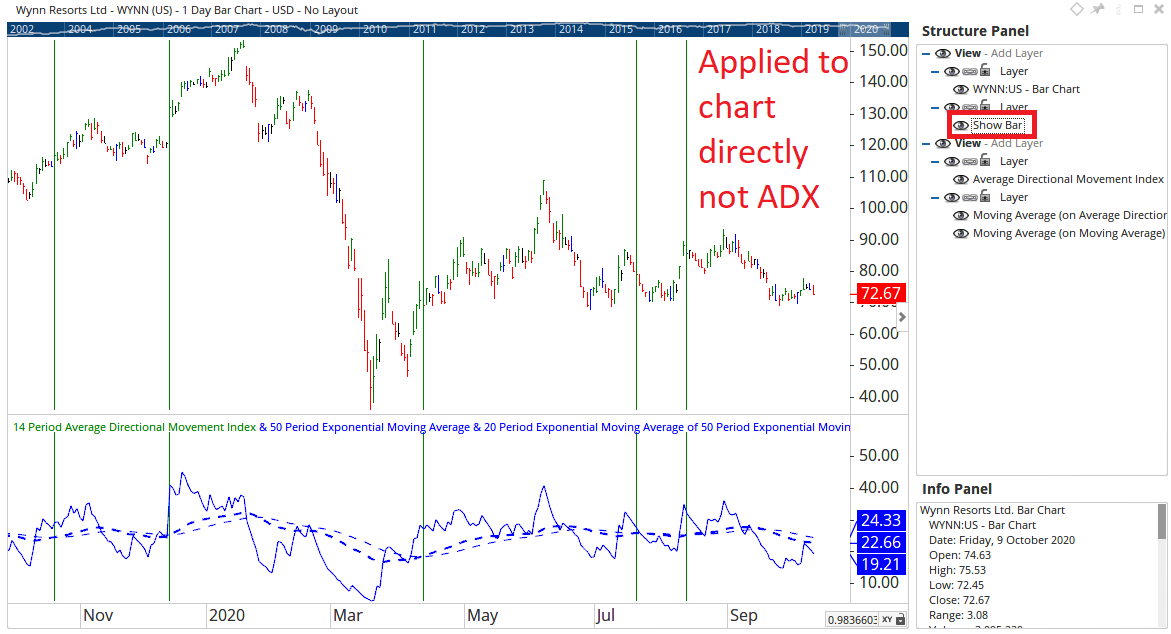
If i apply a Show Bar using your script directly to the ADX window, i get the same results you are seeing. This is because the Show bar is not referencing the charts data, it’s referencing the ADX. So you end up with an ADX of an ADX, throwing the results you see out.
Delete the Show Bar from the ADX and apply it to the chart directly. Use your script and adjust it to display as a Line (across all views) and you will see that it will show the expected results.
Rule of thumb would be, whichever item you apply the Show Bar tool to (Chart, ADX, RRG, etc) that is what the Show Bar will consider to be the Close() value.