Hi,
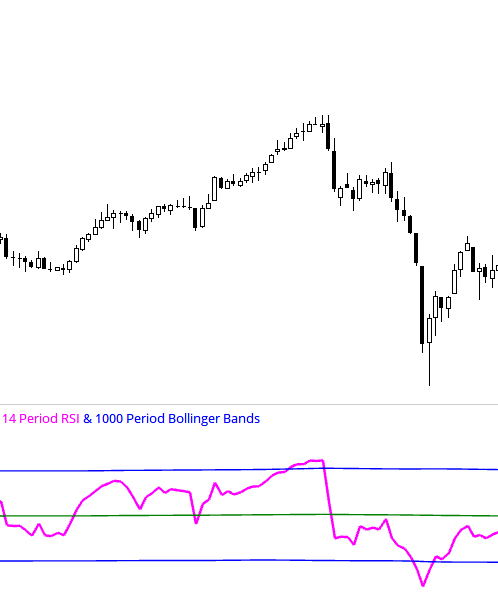
I’d like to create a watchlist with a TRUE/FALSE column on whether the RSI(14) is above (or below) its Bollinger Bands (1000 period, 2 STDDEV).
Any help is appreciated!
Julius
Hi,
I’d like to create a watchlist with a TRUE/FALSE column on whether the RSI(14) is above (or below) its Bollinger Bands (1000 period, 2 STDDEV).
Any help is appreciated!
Julius
Hi Julius,
You can use the following in a watchlist, scan, or Show Bar to identify when the RSI is outside the BB levels. Note is uses the BarCount function to ignore stocks with less than 1000 days of data required to calculate the BBs:
//Get RSI value
R1 = RSI(BARS=14);
//Get BB levels
BBU1 = BB(R1,BARS=1000, DEFAULT=UpperLine);
BBL1 = BB(R1,BARS=1000, DEFAULT=LowerLine);
// Only include stocks with > 1000 days of data
D1 = BARCOUNT()>1000;
//Is RSI outside the BB levels?
D1 and
(R1 > BBU1 or
R1 < BBL1)