Hi. Today we had the 6th day on the SPX with a lower high and lower low. I created a script to find this and then created a scan from that script. It always finds the first occurrence matching. How can I change the scanner to find all matching occurrences?
The scanning manager will only show the first instance, so might be best to use the Show Bar instead. Did you use the Days Down function DD()? By default it uses closing prices, but you can nest the high and low values:
DD(HIGH())==6 and
DD(LOW())==6
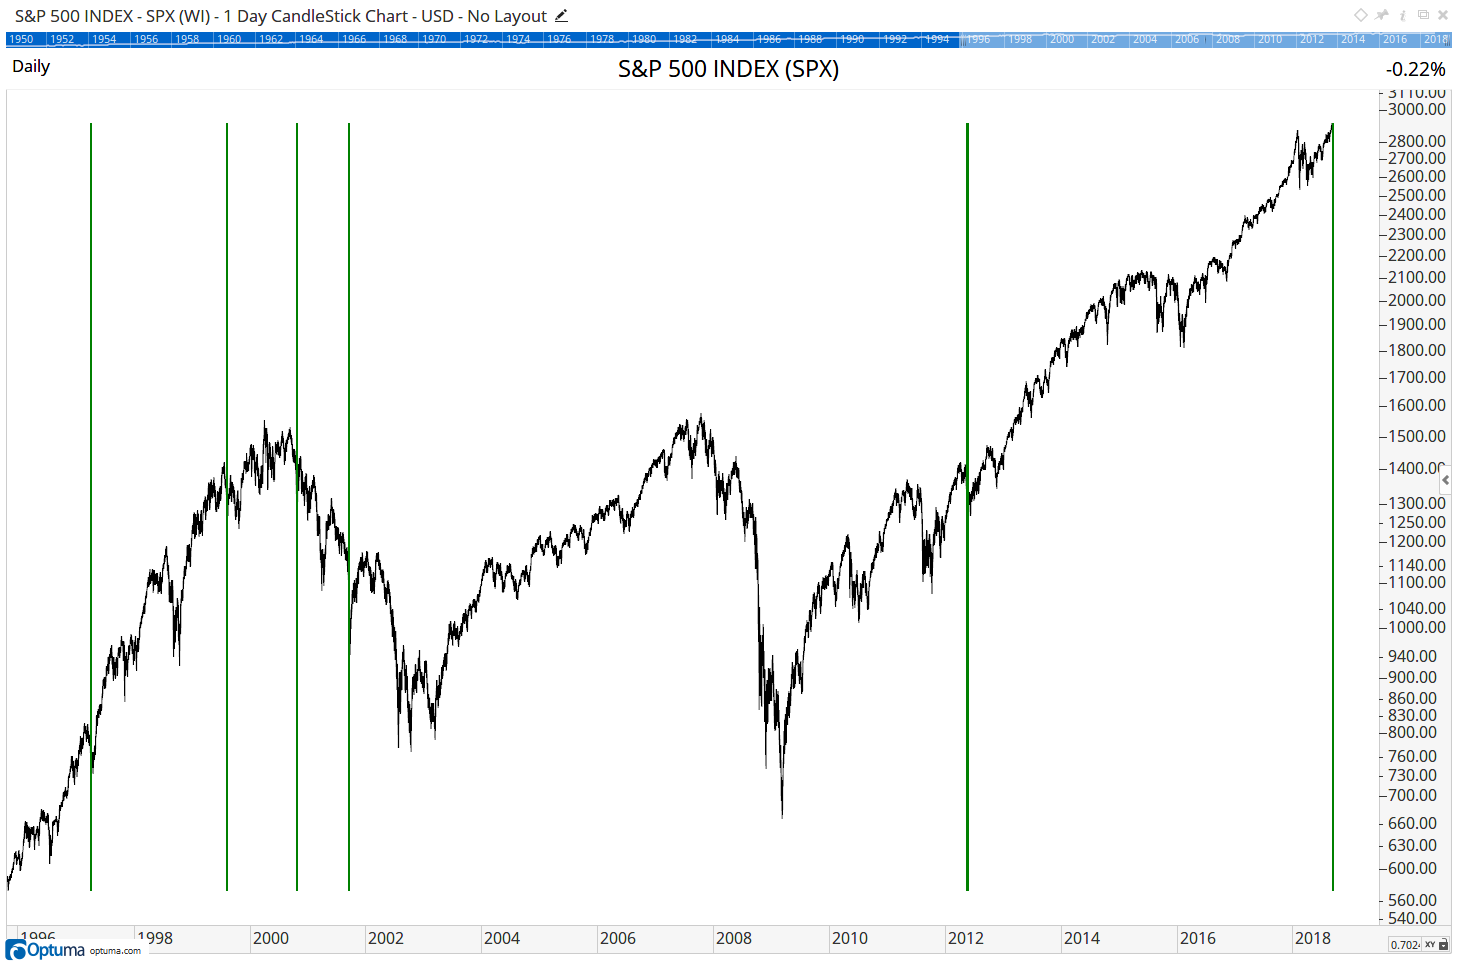
Here’s the SPX, showing this happened on Friday for the first time since May 2012:
You need to go back to 2001 for 7 consecutive high/lows.