Script assistance please

Hi, I am not sure why this coding is not working for the code AC8. Can someone please help on a weekly chart.

(if((BARCOUNT()>=200), ((CLOSE() > MA(BARS=100, STYLE=Simple)) or (CLOSE() > MA(BARS=200, STYLE=Simple))),(CLOSE() > MA(BARS=100, STYLE=Simple))))


I am trying to show a bar where there are more than 200 weekly bars where close is either higher that the 100MA or 200MA and if there are less than 200 weekly bars I am trying to show a bar for where the close is higher than the weekly 100MA. Nothing is being plotted on my chart when I believe it should be showing the show bars.

When I apply the formulas separately ie

((CLOSE() > MA(BARS=100, STYLE=Simple)) or (CLOSE() > MA(BARS=200, STYLE=Simple))) shows the bar when there are more than 200 bars; and

CLOSE() > MA(BARS=100, STYLE=Simple) shows the bar when there are more than 100 bars

but when combined in the function they do not work - I am trying to get the combined effect using the if function but instead no show bars are showing at the beginning of the chart.

Can someone please let me know what I am doing wrong. Thanks.

Karen

Hi Karen,

when chasing these types of problems I break each part down into individual scripts. So using your scripts I can to V1, V2 and V3 = (V1 or V2). I then apply each individual script to SHOWBARs and here is the chart with them all on:

The final v3 (the magenta SHOWBAR) script is:

// Karen's Ticket #54667 20190914

V1 = ((CLOSE() > MA(BARS=100, STYLE=Simple)) or (CLOSE() > MA(BARS=200, STYLE=Simple))) ;

v2 = CLOSE() > MA(BARS=100, STYLE=Simple);

v3 = If(v1 or v2,1,0);

v3

The workbook with the individual scripts is attached.

Cheers

Trevor

20190914-Karens-Ticket-54667-V3-V1-or-V2.owb (12.8 KB)

Thanks for that. The problem I was actually having was when there are less than 200 bars which is the case for the code AC8 (ASX) on a weekly chart the arrows were not showing up when I combined the formula and was using the Barcount function yet they were when I did the formulas individually. Can you please assist with that formula?

Thanks,

Karen

Hi Karen,

Please post the script code you are trying to use, otherwise we are only guess at what you are trying to do.

Cheers

Trevor

Hi I posted it above in my first line of code.

(if((BARCOUNT()>=200), ((CLOSE() > MA(BARS=100, STYLE=Simple)) or (CLOSE() > MA(BARS=200, STYLE=Simple))),(CLOSE() > MA(BARS=100, STYLE=Simple))))


Thanks,

Karen

Further to the email above I have attached 3 charts of AC8.

  1. The left chart I have tried to use show bars to calculate how many bars there are in the weekly graph. I used the formula: (if((BARCOUNT()>=200),BARCOUNT(),0)) Clearly there are 314 bars (ie more than 200). I don't think the results coming back are correct - I would have thought that it would have counted up from 1 to 114 straight after the first 200 bars. Also from the time price label you can see that the count of the bars are clearly more than 200 bars.
  2. The middle chart I have then used the same formula in the show bar as above: (if((BARCOUNT()>=200),1,0)) and instead have drawn an arrow where the 314 was showing in the first chart. This isn't correct - it should show an arrow for 114 bars after the first 200 bars.
  3. <li style="text-align: left;">The third chart I have used in the show bar formula: (if((BARCOUNT()>=200), ((CLOSE() > MA(BARS=100, STYLE=Simple)) or (CLOSE() > MA(BARS=200, STYLE=Simple))),(CLOSE() > MA(BARS=100, STYLE=Simple)))) This formula brings back no bars.
Please let me know what I am doing wrong as I don't think the formulas are working properly and I cannot understand why the results are coming back the way they are.

Ultimately I am trying to get the formula in item 3 to work but if the formulas in item 1 and 2 are not working then the formula in item 3 will not work. Please assist with this.

Thanks,

Karen

File attached.

Hi Karen,

The first problem is I think you misunderstand what the BARCOUNT() function does.

As stated in the Knowledge Base article https://help.optuma.com/kb/faq.php?id=961 describing the function it “will return either the total number of data bars that are available for a symbol, or the total number of bars on the screen at the time”. Thus your script (if((BARCOUNT()>=200),BARCOUNT(),0)) will return the total number of bars in the code, that the 314 Bars on the Weekly Chart of AC8. If you apply that script to a SHOWVIEW it reflects that result.

Your script (if((BARCOUNT()>=200),1,0)) will, because the BARCOUNT is greater than 200, return a result of 1. However, if you change the 200 to 400 you’ll find it return 0, which is to be expected as the BARCOUNT = 314. Again, using a SHOWVIEW will demonstrate this.

So, I conclude that using BARCOUNT is not the appropriate function for what you are attempting to achieve, which I understand from your first post to be:

Show those bars bars that:

1 occur after the signal of a Close crossing above, and remaining above, the MA200 for longer than 200 bars, ie the first SHOWBAR will be 200 Bars past the first Close above the MA200 and SHOWBARS will show for all Bars thereafter until the Close crosses below the MA200, or

2 occur after the signal of a Close crossing above, and remaining above, the MA 100 for longer than 200 bars, ie the first SHOWBAR will be 200 Bars past the first Close above the MA100 and SHOWBARS will show for all Bars thereafter until the Close crosses below the MA100, and

if that criteria is not met then show those bars less than 200 bars that:

3 occur after the signal of a Close crossing above, and remaining above, the MA 100 for less than 200 bars, ie the first SHOWBAR will be signal the first Close above the MA100 and SHOWBARS will show for all Bars thereafter until the Close crosses below the MA100

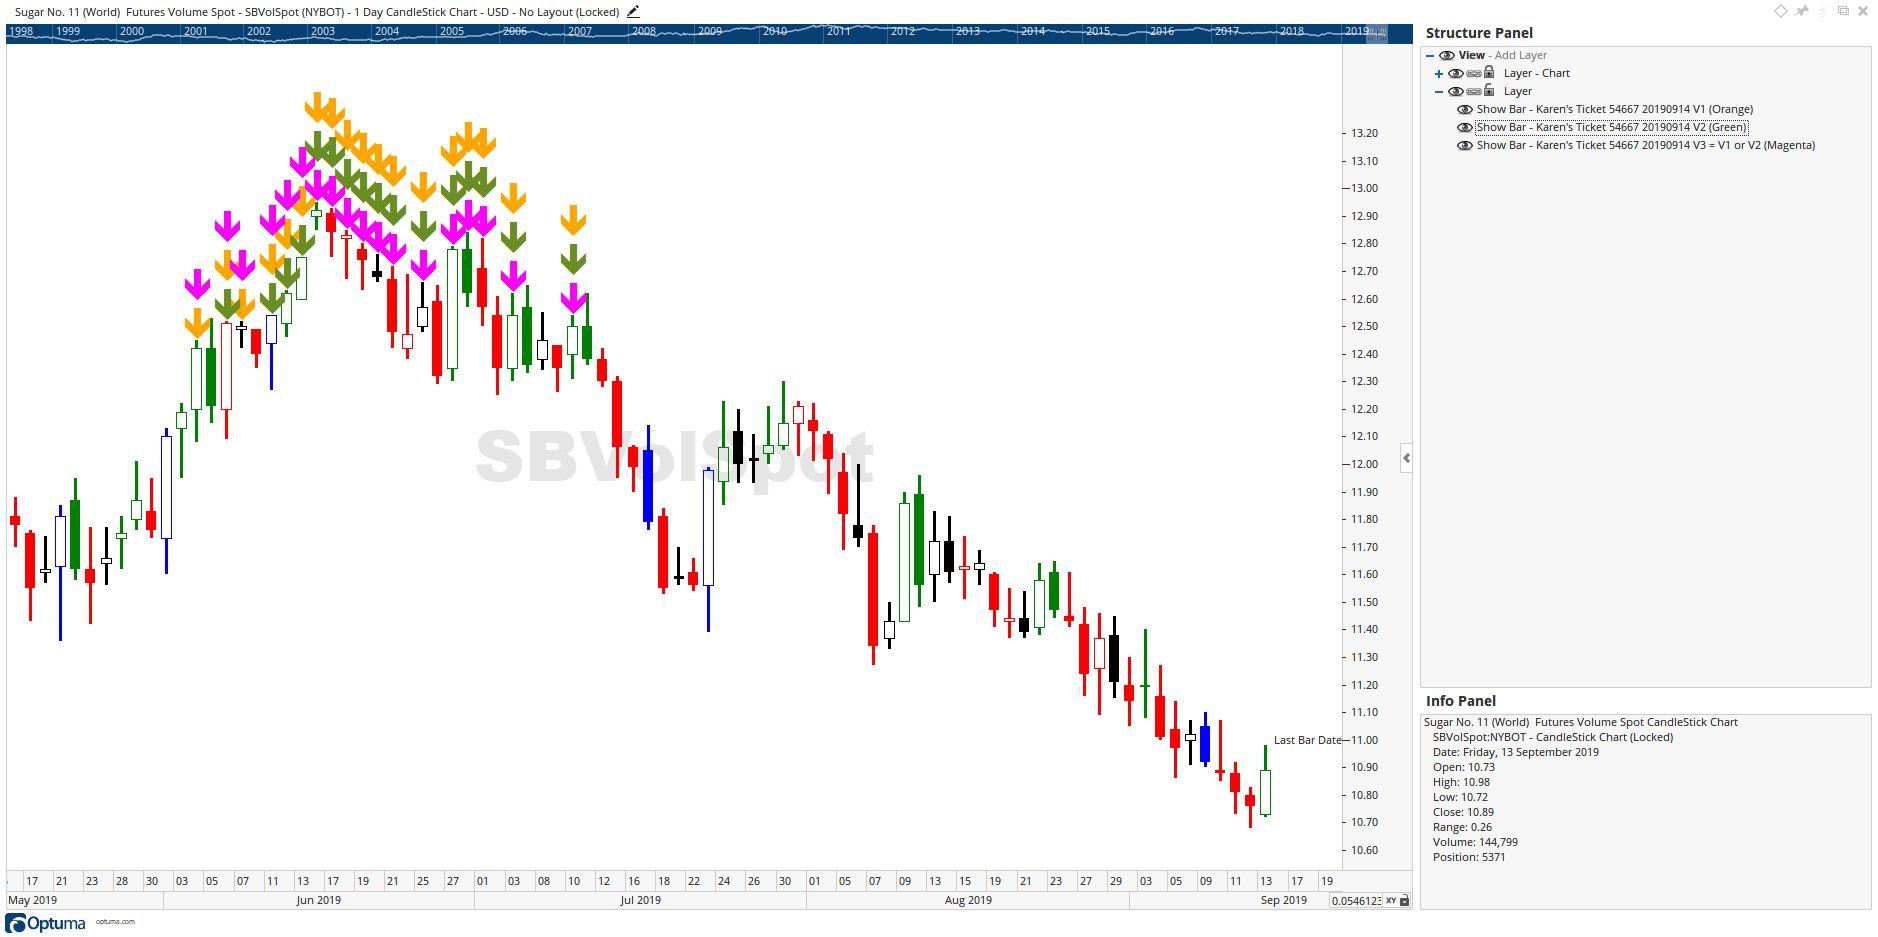
The following script applies the criteria 1 and 2 above with the result shown in the first chart below (Note: I've use Daily Charts, the criteria are not met on a Weekly Chart):
// 20190922 -1 Karen's Ticket 54667

v1= Close() >= MA(BARS=200, CALC=Close);
v2= Close() < MA(BARS=200, CALC=Close);
//Count the number of times V1 occurred since V2
v3 = COUNTMATCHSINCESIGNAL(V1,V2);
// v4= Close() >= MA(BARS=100, CALC=Close);
v5= Close() < MA(BARS=100, CALC=Close);
//Count the number of times V4 occurred since V5
v6= COUNTMATCHSINCESIGNAL(V4,V5);
IF(v3>=200 or v6>=200, 1, 0)


20190922 -1 Karen's Ticket 54667

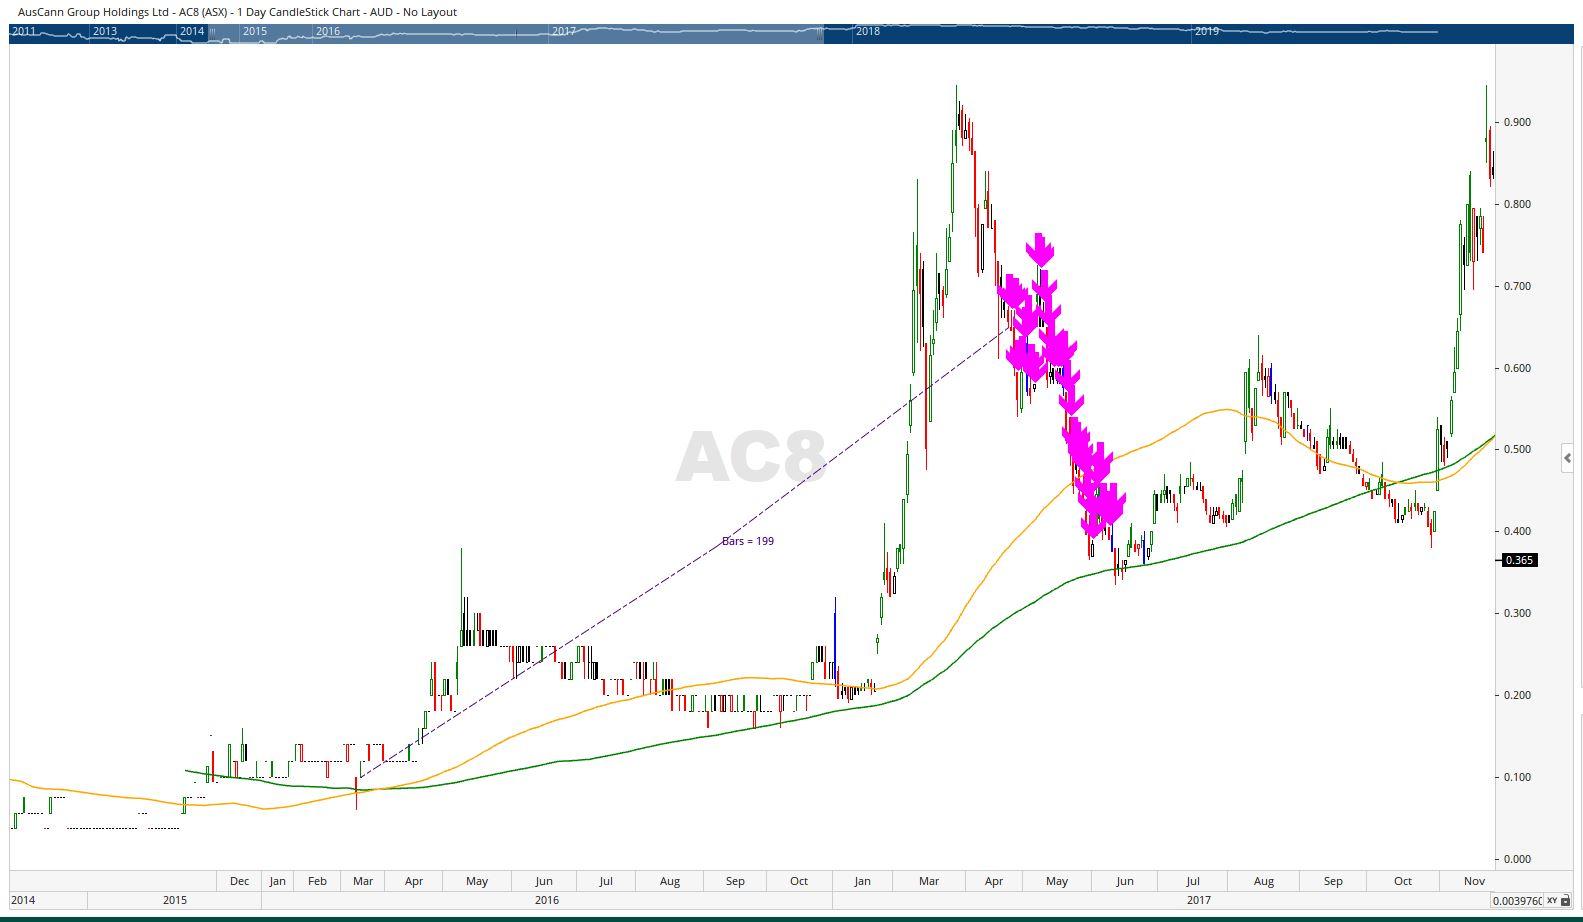
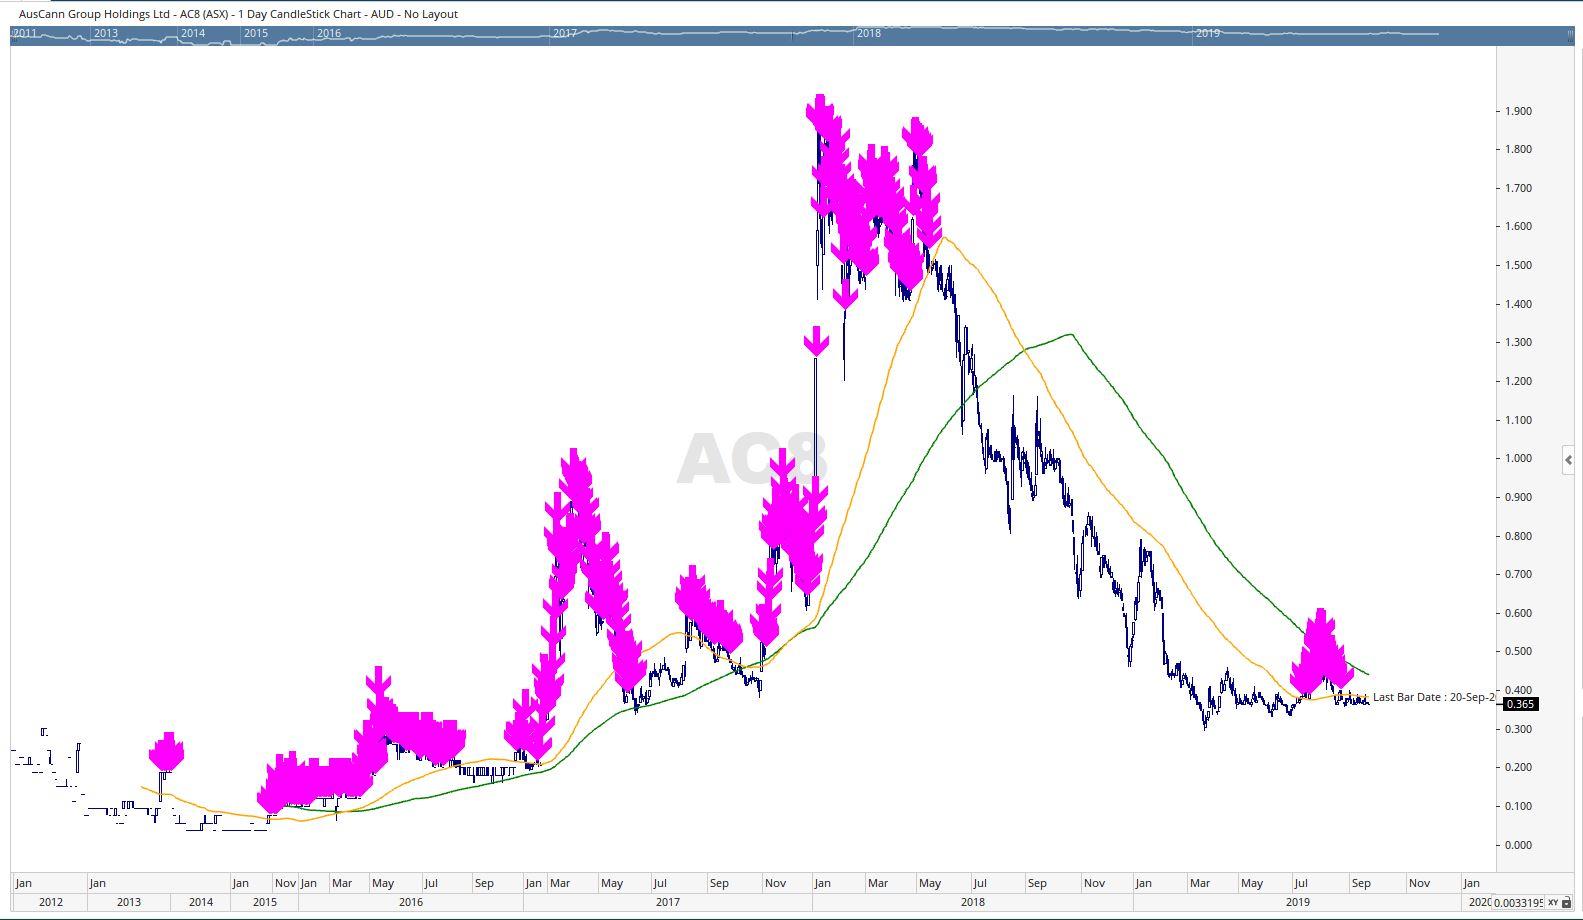
Adding the 3rd criteria listed above results in this script, which produces the result on the chart below:

// 20190922 -2 Karen's Ticket 54667
v1= Close() >= MA(BARS=200, CALC=Close);
v2= Close() < MA(BARS=200, CALC=Close);
//Count the number of times V1 occurred since V2
v3 = COUNTMATCHSINCESIGNAL(V1,V2);
//
v4= Close() >= MA(BARS=100, CALC=Close);
v5= Close() < MA(BARS=100, CALC=Close);
//Count the number of times V4 occurred since V5
v6= COUNTMATCHSINCESIGNAL(V4,V5);
IF(v3>=200 or v6>=200, 1, If(v6<200 and v4, 1, 0))

20190922 -2 Karen's Ticket 54667

Is that what you are looking for Karen?

Cheers

Trevor

Thanks Trevor, I’ll have to work through the formula. The key for me was what function do I use to count the number of bars since a stock has listed (but not just the current bar)? ie I would want the 1st bar to show a number of 1 using the show bar, the 2nd bar to show the number of 2 etc. ie I want the BARCOUNT() function to be able to effectively apply to each bar from listing not just the current bar.

Is the relevant function COUNTMATCHSINCESIGNAL to do that?

Thanks,

Karen

Hi Karen,

I’m unsure as to exactly what the result is that you are looking to see. You haven’t mentioned if the script I given you thus far is going some way towards the result you desire. Can you manually annotate a chart to provide a picture of how you are expecting the Showbars from the script is to be displayed and numbered. You know the old saying " A picture is worth a thousand words".

Cheers

Trevor


Hi Trevor, I’m just looking for the function that would return a number for each bar (including the current day’s bar) for what number bar it is from the date the stock listed. I understand that BARCOUNT() function only works for the current bar so what function will I need to use to get a number returned for each bar? Please see attached chart for what I mean.

Thanks again,

Karen

Please see attached chart.

Hi Karen,

Now I understand what you are looking for - the actual bar number from the start of the chart data, I would call this the BARNUMBER.

Unfortunately as I understand the situation at present there is no BARNUMBER function within the Scripting module, which is the data you, and I from time too time, are looking for. (It is data available in the Optuma Programming Module, if you are into Pascal programming.) The nearest you can get at present is the BARDATE, which might do what you want to try, but be careful because BARDATE returns the date and when used to calculate periods between dates the result includes weekends and holidays, ie the result is “calendar days”, not the number of Bars.

I’ve run into the need for a BARNUMBER function from time to time in my script creation, including one script I was working on yesterday, so I’ve asked for it on the Optuma Feature Requests Forum. You might like to support that request of mine.

Cheers

Trevor

Hi Trevor, thanks for your reply. Yes I think it would be a good idea that the function exist as it does in other packages and without it makes it difficult to calculate basic equations.

How do we go about getting Optuma to develop that function quickly as it can’t be that difficult to do if t is just counting the number of bars from the listing date? Will they read this post or do we need to submit it elsewhere?

Thanks,

Karen

Hi Karen,

I see you’ve supported my request on the Feature Requests Forum. I’m sure the smart Optuma Guys will see it there and respond appropriately.

Cheers

Trevor

Thanks Trevor, if you can let me know when they have developed that function that would be great. I will do the same if I notice it first.

Thanks,
Karen

hi all
I am struggling to script “closing price is greater than the 13MA” I have tried the following
CLOSE() > MA() 13
and every variation of this. But it is still piucking up stocks that close below the 13MA

Has anybody any idea on how to correct this

thanks

andrew

Hi all

I am running the followign script to search for stocks where %K is below 40 on a slow stochastic 5, 2, 3. And above zero on the MACD 3,10,15

MD1 = MACD(BAR1=3, BAR2=10, OSC=15);
MD1.OSCILLATOR > 0 and STOCH(TYPE=Slow, BAR1=5, BAR2=2, BAR3=3) is < 40

Using this I thought the recent close of CSL would be highlighted. However it didn’t come up in a search this morning (30-07-22). Only PSL and SSL came up on this search. Have I got my scripting wrong?

regards

andrew

Hi Andrew,

The Syntax is incorrect in your script. For Close being greater than a 13SMA you’d use:

CLOSE() > MA(BARS=13)

Note, you can click on MA() in the script editor and set the properties there rather than typing them in. This will make sure the correct syntax is being used in the script.

Hi,

For your MACD / Stochastic script i’d use the following:

V1 = MACD(BAR1=3, BAR2=10, OSC=15) ;
V2 = STOCH(TYPE=Slow, BAR1=5, BAR2=2) ;
V2.%K < 40 and V1.Oscillator > 0

For CSL the last time this criteria was met was on the 25-07-2022.

On Friday, the Oscillator of the MACD was below 0 which is why it did not pass.