Hi,
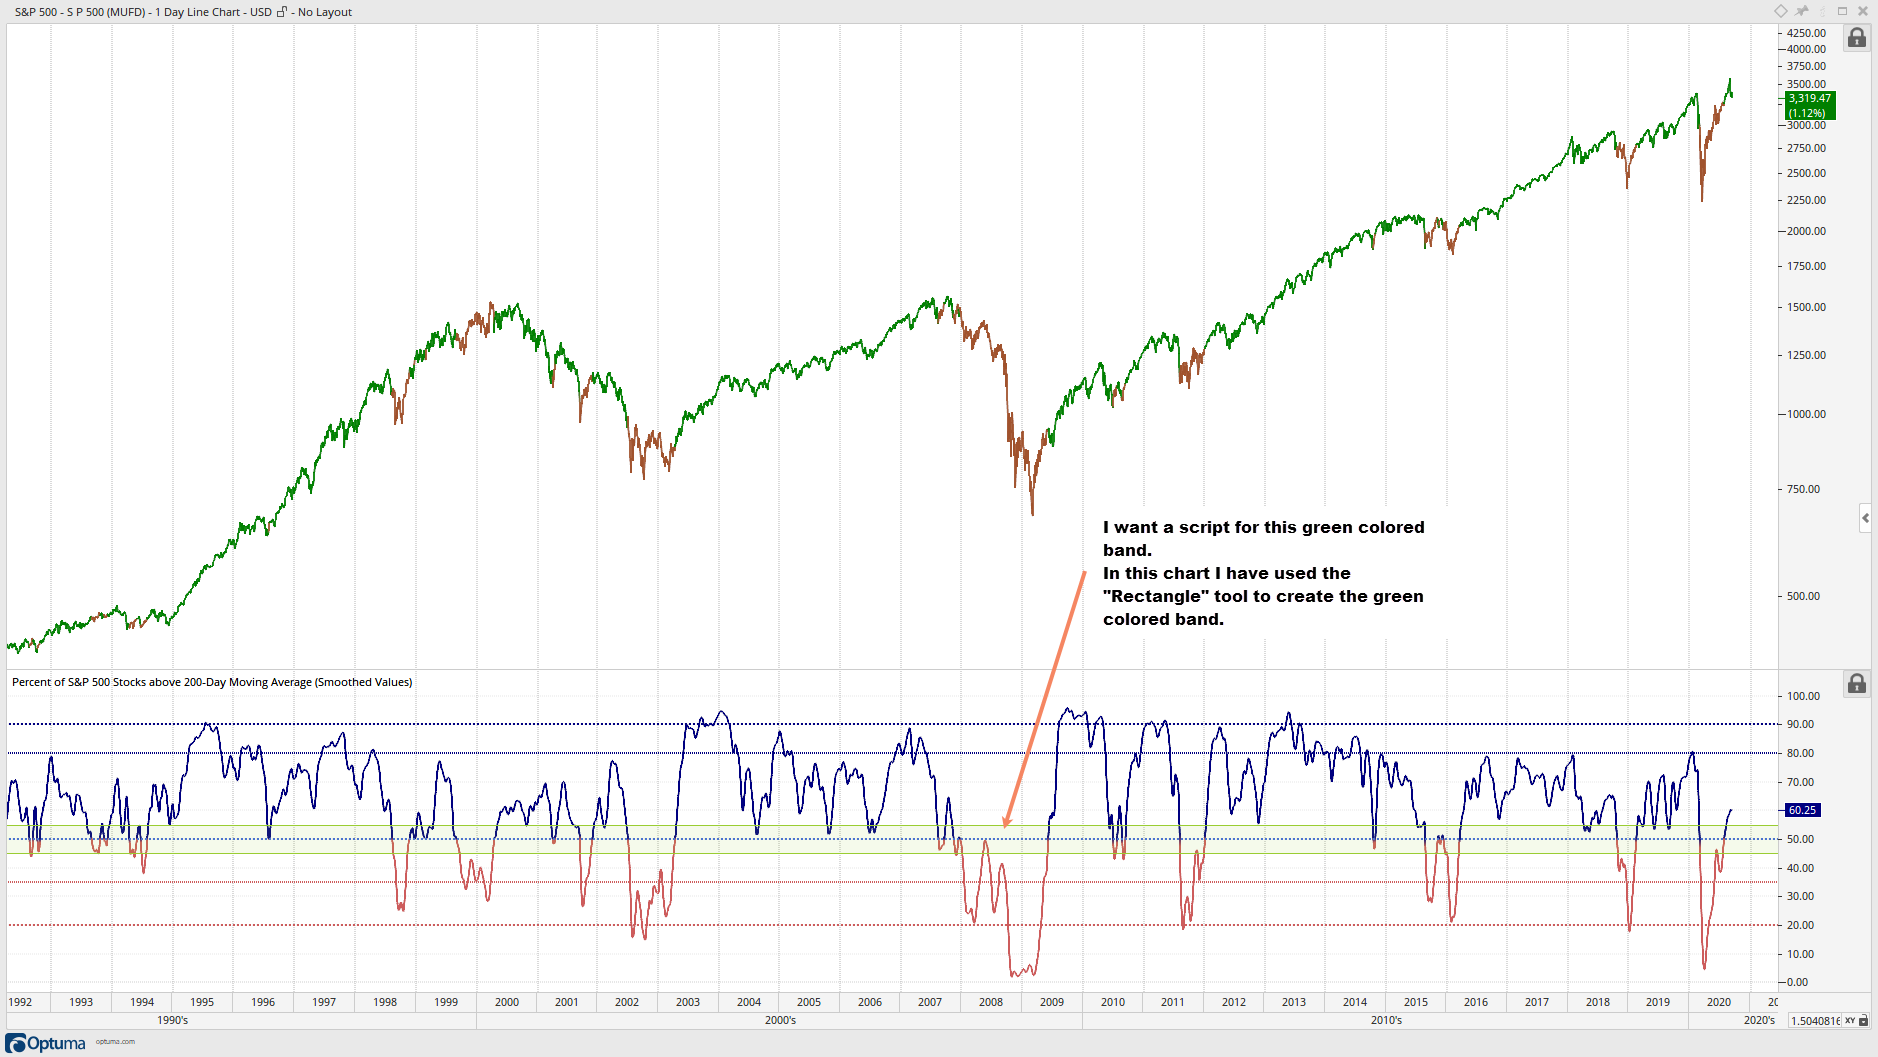
I want create a script for a colored band on a chart and on an indicator. I have attached a screen shot of a chart so you can better see what I mean. In the chart I have used the “Rectangle” tool to create the colored band but if possible I want do it with a script.
Thanks,
Thomas