Is there a way to calculate the percent of S&P 500 stocks that are down 10% or more YTD?
Any help would be much appreciated.
Hi,
Yes, if you have the Breadth module you can build a custom breading using a modified version of the following script Darren posted earlier this week:
//Get year of 1st trade;
V1=FIRST(YEARNUM())==2021;
//Calc YTD %;
YTD = ROC(Year(PERIODAMOUNT=1), BARS=1)/100;
//Calc % from First Open;
IPO = FIRST(OPEN());
D1 = ((CLOSE()-IPO)/IPO);
//If 1st trade this year use % since First Open, else use YTD;
RES =  IF(V1, D1,YTD);
RES < -0.10
Set this up to run on the SP500:

Based on the current value 7% of SP500 stocks have a YTD performance of -%10 or more.
Thank you.
Hi Matthew,
I think may work better when creating a time series based on YTD performance over multiple years.
The signal is when the YEARNUM() changes at the beginning of the year, and using the CHANGESINCESIGNAL() function from that point to calculate the YTD% for each day. However, we need to take the close of the day before the signal (ie the close of the previous year) so need to use the [-1] offset.
//Signal on change of year;
V1 = YEARNUM() <> YEARNUM()[1];
//Change since day before signal to calc YTD%;
CHANGESINCESIGNAL(V1[-1]) < -10
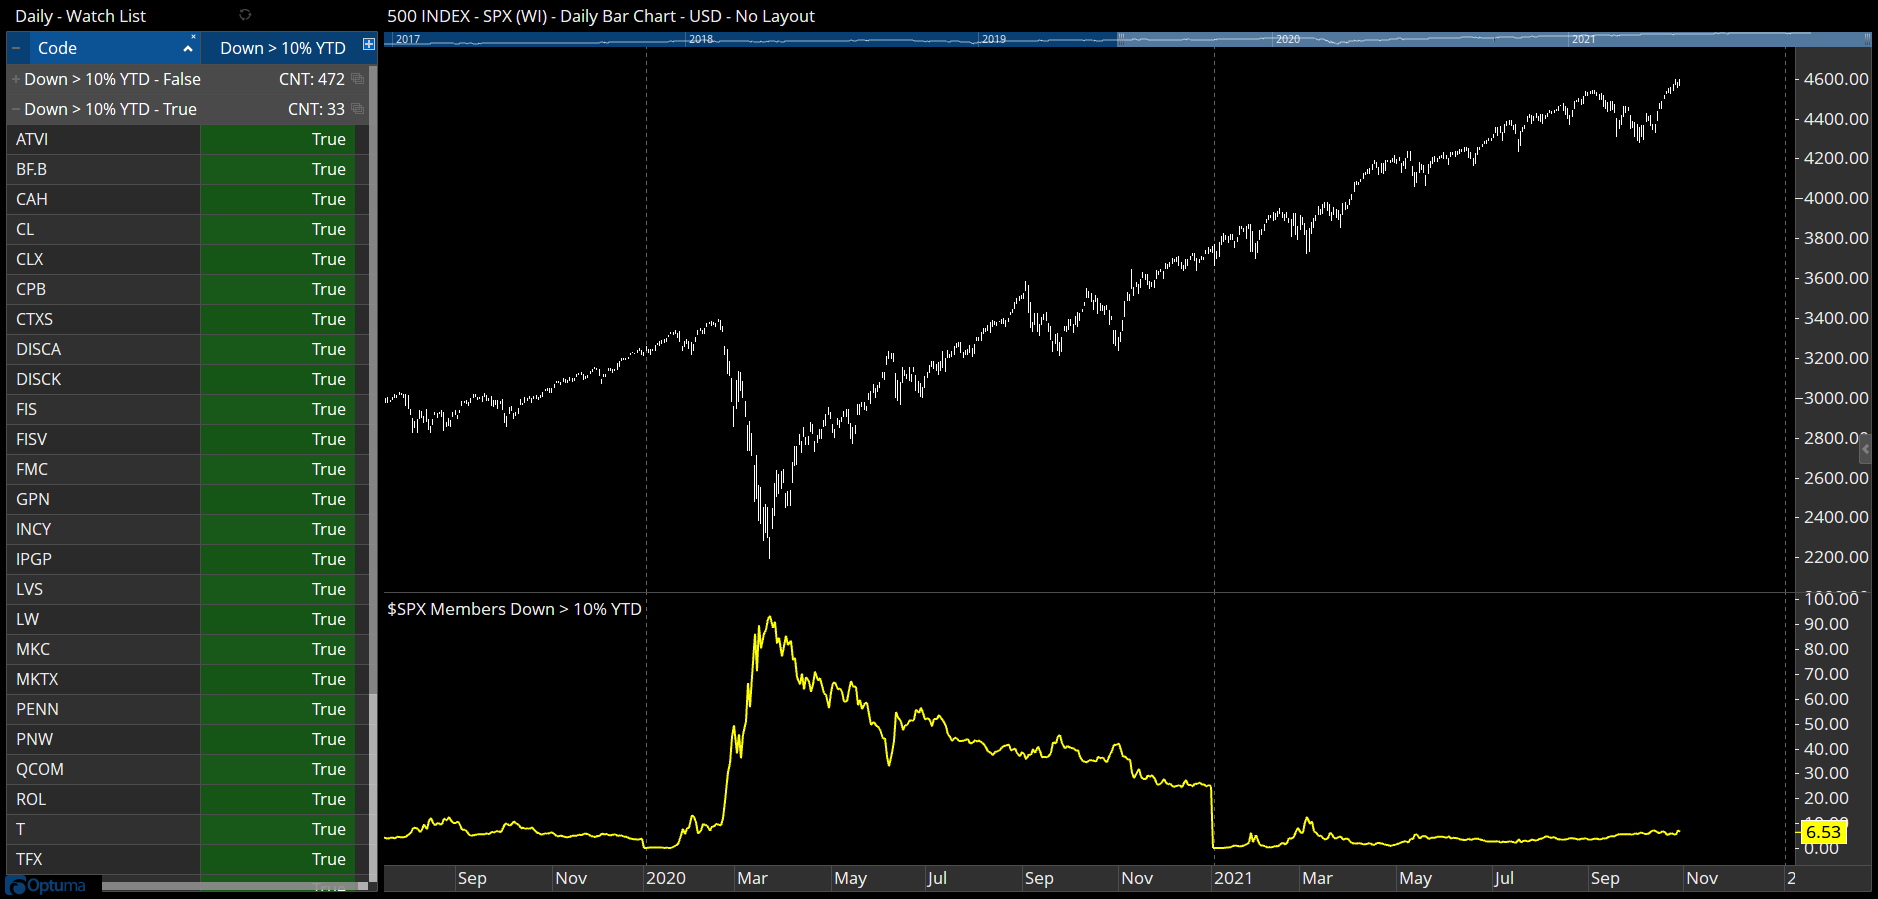
Currently there are 6.5% of SPX stocks (33) down more than 10% this year (confirmed in the watchlist). Because the calculations are from the beginning of the year it resets each January: