ROC(#BARS=5) <= #Percentage:3
and
TO(Week(PERIODAMOUNT=1)) > 1000000
What I’m trying to do is a scan where the closing price hasn’t changed by more than 3% over the last 5 bars (and volume >1M over the past week).
ROC(#BARS=5) <= #Percentage:3
and
TO(Week(PERIODAMOUNT=1)) > 1000000
What I’m trying to do is a scan where the closing price hasn’t changed by more than 3% over the last 5 bars (and volume >1M over the past week).
Thanks Alexander. As written, the rate of change formula will include all those with less than 3% change with no downside, so for example ABC on the ASX would be included because it is currently -25% over the last 5 days.
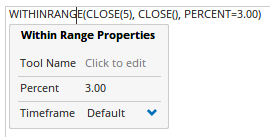
Instead you can use the WITHINRANGE() function to filter where the latest close is within +3% or -3% of the close 5 days ago:
WITHINRANGE(CLOSE(5), CLOSE(), PERCENT=3.00)
For the volume condition, the TO() function is the turnover in $, not volume, and because it has been set to weekly data it only counts Monday to Friday, not a rolling week.
Try this instead for more than $1m in trading over the last 5 days using the Accumulation function:
ACC(TO(), RANGE=Look Back Period, BARS=5) > 1000000
Or for 1m in volume:
ACC(VOL(), RANGE=Look Back Period, BARS=5) > 1000000
Sorry Darren. Now I’m even more confused. If my current script would include ABC, then it’s not what I want. I know this, because the way I’ve written it, the script isn’t giving me what I want. I think I’ll try rewording my question. It may not be possible to script exactly what I want.
I’m trying to get the closing price to remain within a range of 3% over 5 days. Or expressed another way, no more than 1.5 % from the average close of the last 5 days.
For example, 5 prices might be $1.00, $1.01, $.98, $.99, $1.01. So the maximum range is 3% over the 5 days (.98 - 1.01)
In another example, if I had $1.00, $1.03, $.98, $.97, $1.01, Even though it it never extends beyond 3% from day 1 ($1.00), the range over the 5 days is 6% (.97 - 1.03). This is what I don’t want.
In other words, I’m looking for stocks with closing prices which have very low volatility over the last 5 days.
OK thanks. That would be a bit more difficult so if you’re interested in a scripting consultation let us know and we’ll look in to it, or maybe someone else would be willing to reply with a solution. Are you only interested in closing prices and not high / low prices?
There are a couple of other easier ways to measure and compare volatility:
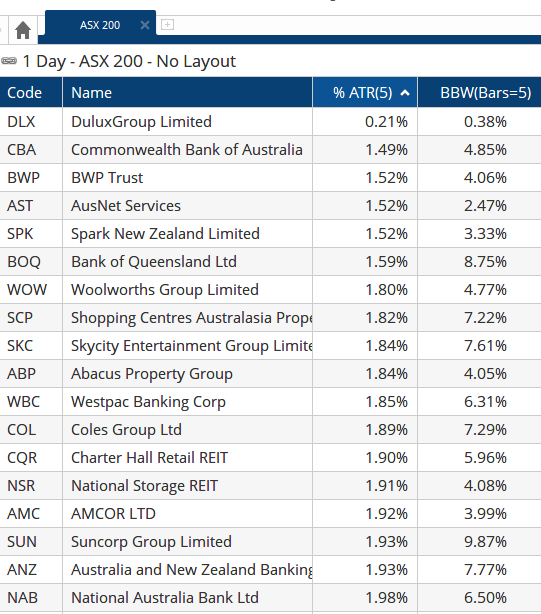
1: Average True Range expressed as a percentage of the close - ATR(BARS=5) / CLOSE()
2: Bollinger Bandwidth - BBW(Bars=5)
Here’s the ASX200 sorted by lowest ATR as a % ie least volatile over the last 5 days, along with the BBW% (save and open the workbook attached):
Volatility.owb (101 KB)
Yes, I’m only interested in closing price volatility.
Stocks which over 5 days close no more than 1.5 % deviation from the average of the 5 closes.
I’m happy to pay someone to script this for me. Do I have to go through the regular channel, or will you arrange it / or do it?