Hi All,
Thanks for the suggestion Henry, that's a neat trick I must remember. It looks to be identifying the "1st Tops" correctly for me.
Now I have new conundrum
My objective is to identify double tops, ignoring intermediate "swing steps", but having the 2nd Top between 0 and 0.5% higher than the 1st Top of the pair.
My script essentially comprises four parts:
#1 +++++ Gann Swing Parameters
#2 +++++ Identify 2nd Top of Double Top
#3 +++++ Identify 1st Top of Double Top, ie the Top preceding 2nd Top Signal
#4 +++++ Compare 1st and 2nd Top, 2nd Top to be between 0 and 0.5% higher than 1st Top
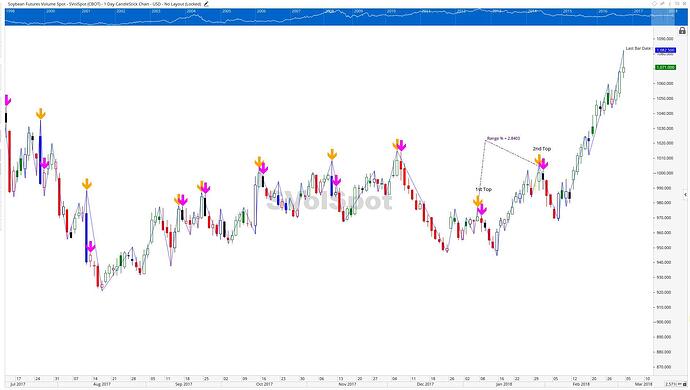
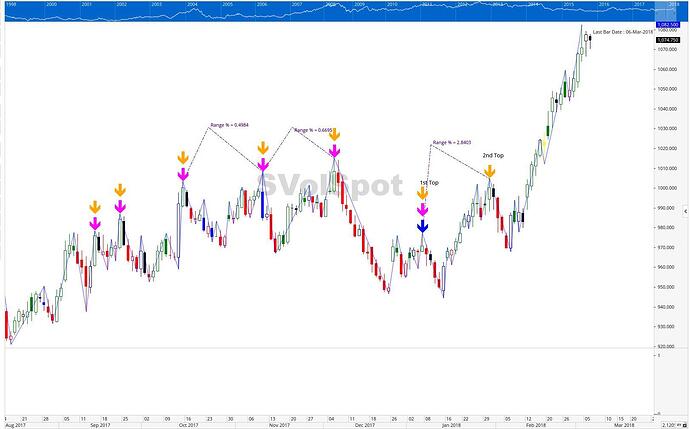
The first 3 parts appear to be working correctly, as the 2nd Top and 1st Tops are identified using SHOW BARS for those portions of the script. You can see this in the attached Workbook, 2nd Tops have an Orange arrow, 1st Tops Magenta arrow (and "criteria meeting" double Tops a Blue arrow).
Part #4 is driving me nuts , and I haven't got much more hair to pull out!
While it appears to identify some of the Double Tops being sought, it misses some and it also identifies others that do not meet the limiting 0 to 0.5% criteria
I've been attempting to identify the cause of my problem using the //PLOTS in a SHOW VIEW, but therein rests another problem
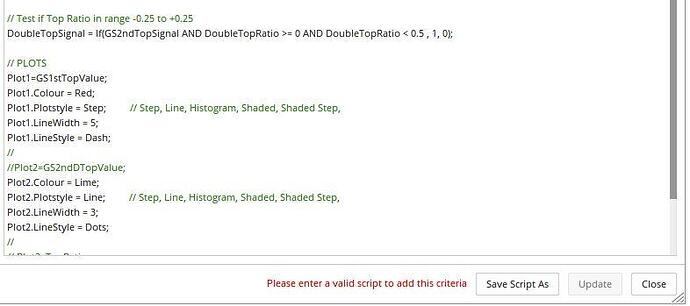
When I remove the // comment delimiters Script Manager tells me "Please enter a valid script to add this criteria" and I'm darned if I can work out why not
So here is my script:
// Double Top: 2nd 0 to 0.5% greater than the 1st
// Setup Signal:
// 1 Day Gann Swing
// Double Top with
// 2nd Top between 0% and +0.5% of the 1st Top
// Lower Tops each side of 1st and 2nd Tops
// #1 +++++ Gann Swing Parameters
// Gann Swing 1 Day
GS1 = SWINGEND(GANNSWING(METHOD=Use Next Bar, DAY(PERIODAMOUNT=1),SWINGCOUNT=1));
// #2 +++++ Identify 2nd Top of Double Top
// Succeeding Lower
TopGS2SucLoTop = GS1[-2] < GS1[0];
// Preceding Lower
TopGS2PreLoTop = GS1[0] > GS1[2];
// Identify 2nd Swing Top
GS2ndTop = GS1[0] > GS1[1];
// 2nd Top Signal
GS2ndTopSignal = GS2ndTop and GS2PreLoTop and GS2SucLoTop AND (TIMESINCESIGNAL(GS2ndTop) < 1);
// +++++ 2nd Top identified
// #3 +++++ Identify 1st Top of Double Top, ie the Top preceding 2nd Top Signal
// use IF() to give the High at the Signal (GS2ndTopSignal) and fill the other positions with zero
GS2ndTopValue = If(GS2ndTopSignal > 0, PriceAtSignal(GS2ndTopSignal, PRICE=High), 0);
// Use NonZero() to shrink the GS2ndTopValue list by removing the zeros so it can use Offset() to find the next / previous signal
GS2ndTopNonZero = NONZERO(GS2ndTopValue);
// Determine 1st Top Signal
GS1stTopSignal = (TIMESINCESIGNAL(GS2ndTopNonZero) < 1 AND TIMESINCESIGNAL(GS2ndTopNonZero) > -1) AND (GS2ndTopNonZero <= OFFSET(GS2ndTopNonZero, OFFSET=-1) or GS2ndTopNonZero > OFFSET(GS2ndTopNonZero, OFFSET=-1) );
// +++++ 1st Top identified
// #4 +++++ Compare 1st and 2nd Top, 2nd Top to be between 0 and 0.5% higher than 1st Top
// Get Double Top High Prices
GS1stTopValue = PRICEATSIGNAL(GS1stTopSignal, PRICE=High);
GS2ndDTopValue = PRICEATSIGNAL(GS2ndTopSignal, PRICE=High);
// % range between 1st Top and 2nd Top
DoubleTopRatio = (GS2ndDTopValue - GS1stTopValue) / ((GS2ndDTopValue + GS1stTopValue) / 2) * 100;
// Test if Top Ratio in range 0 to +0.5
DoubleTopSignal = If(GS2ndTopSignal AND DoubleTopRatio >= 0 AND DoubleTopRatio < 0.5 , 1, 0);
// PLOTS
Plot1=GS1stTopValue;
Plot1.Colour = Red;
Plot1.Plotstyle = Step; // Step, Line, Histogram, Shaded, Shaded Step,
Plot1.LineWidth = 5;
Plot1.LineStyle = Dash;
//
//Plot2=GS2ndDTopValue;
Plot2.Colour = Lime;
Plot2.Plotstyle = Line; // Step, Line, Histogram, Shaded, Shaded Step,
Plot2.LineWidth = 3;
Plot2.LineStyle = Dots;
//
// Plot3=TopRatio;
Plot3.Colour = blue;
Plot3.Plotstyle = Line; // Step, Line, Histogram, Shaded, Shaded Step,
Plot3.LineWidth = 3;
Plot3.LineStyle = Dots;
DoubleTopSignal
Any and all bright ideas on what's causing my problems will be very much appreciated.
Cheers
Trevor
20180307-Test-Double-Top-Show-Bars.owb (236 KB)


