For Optuma clients with the full RRG module who are interested in scanning or testing RRG scenarios see this blog post with examples using the derived indicators (eg Heading, Distance, Velocity, etc):
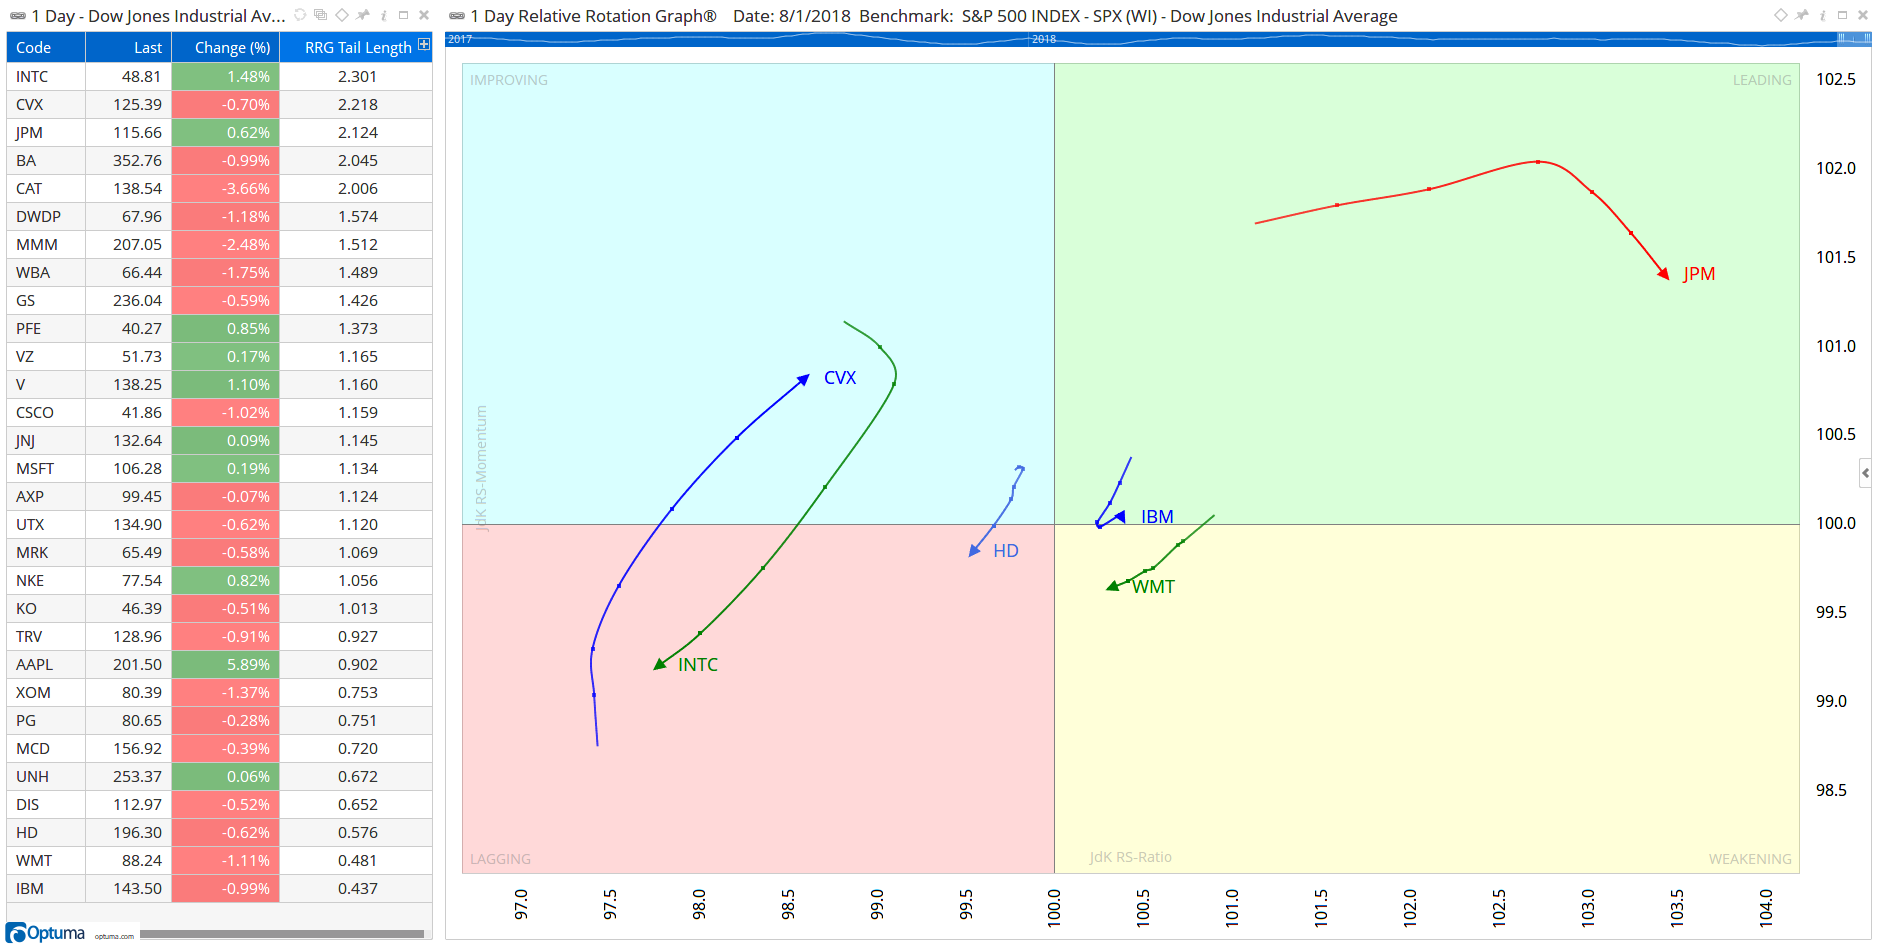
The distance between each data point on an RRG tail is measured by the velocity - JDKRS().Velocity - so to calculate the tail length you can add them together using the Accumulation function ACC() over the required time period. The longer the tail the more momentum in the relative trend.
For a 5 period tail you would use the following using the default benchmark index (ie XJO for ASX, SPX for US stocks):
V1=JDKRS().Velocity;
ACC(V1, RANGE=Look Back Period, BARS=5)
In this example, the Dow 30 have been ranked by tail length, with the longest 3 (INTC, CVX & JPM) plotted on the RRG with the shortest 3 (HD, WMT & IBM with lowest momentum).
To colour code the quadrants in a watchlist column the following (using the default benchmark) will convert the column in to a value, as follows:
0 = Leading
1 = Weakening
2 = Lagging
3 = Improving
JDKRS().Quadrant +0
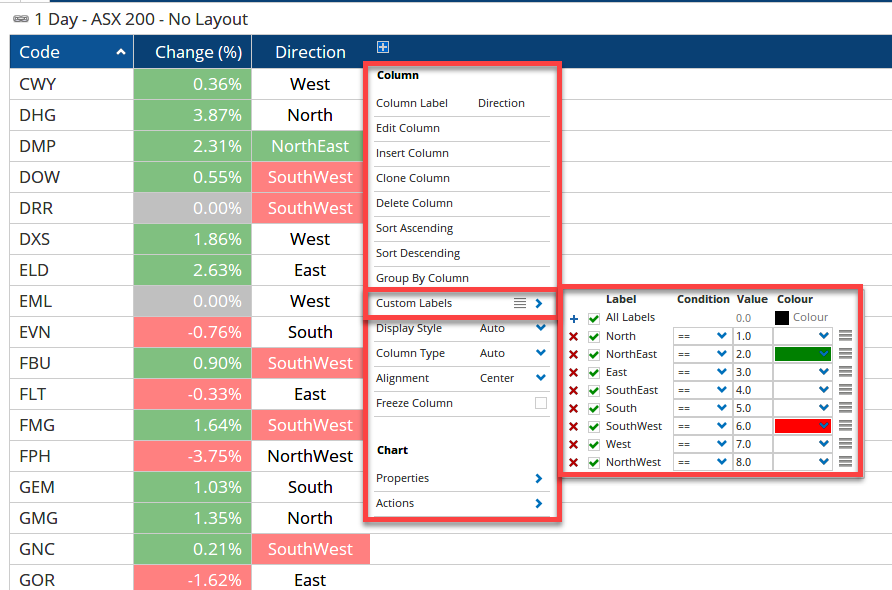
Then label and colour the column using the following Custom Labels:

Attached is a workbook for US industry ETF watchlist with RRG quadrant info in a column and 4 coloured Show View scripts dragged over each other.

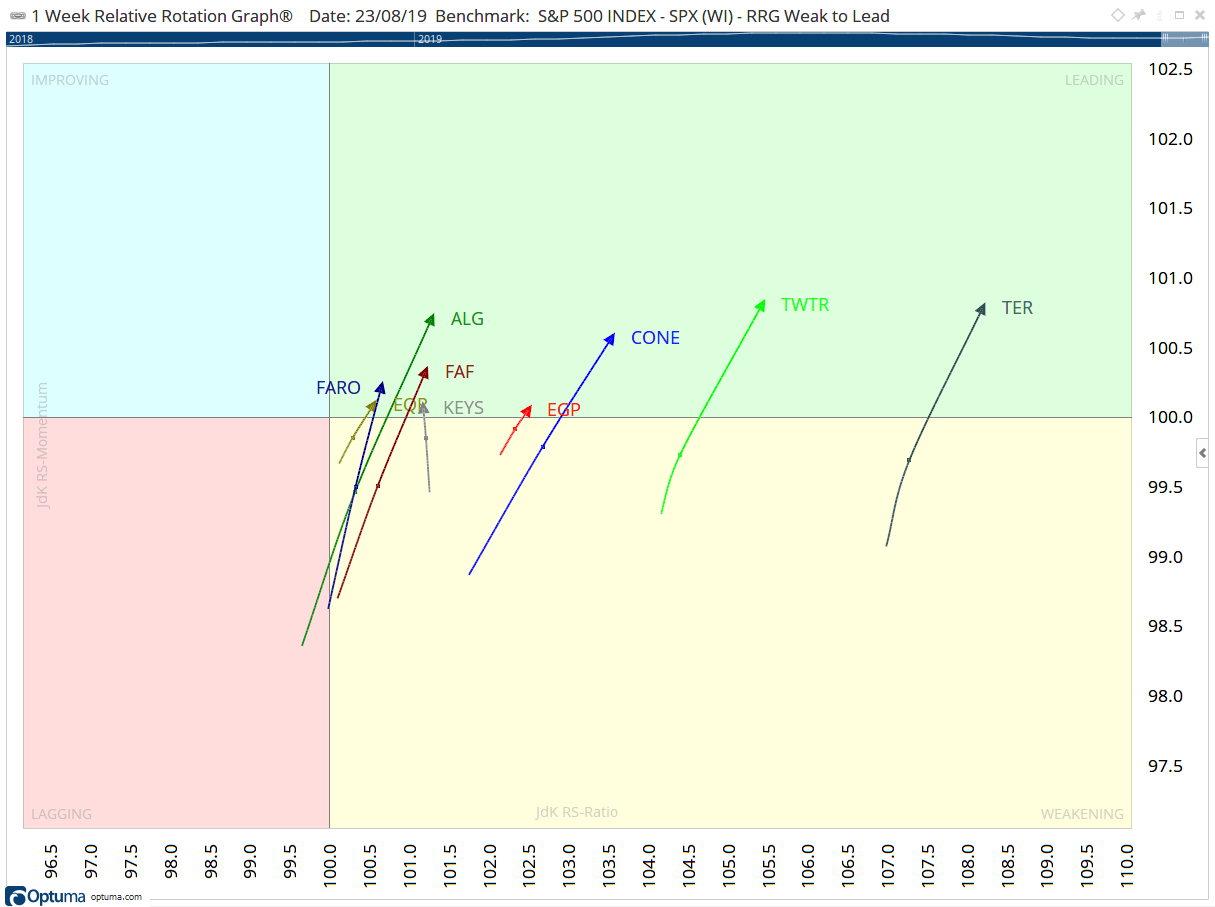
A sure sign of strength is when a stock moves from Weakening back to Leading without rotating to Lagging - basically it rotates on the right side of the RRG chart without the RS Ratio crossing below 100.
We can scan (and test) for when that happens using the following formula:
//When RS Ratio > 100 ie on right side of RRG for at least 2 datapoints
JDKRS().Ratio > 100 and JDKRS().Ratio[1] >100 and
//and RS Momentum crosses above 100 ie moves from Weakening to Leading
JDKRS().Momentum CrossesAbove 100
Scan results:
Using the Heading value we can define ranges to show the general RRG direction in a watchlist by splitting the 360° of the circle into eight equal 45° segments. For example, we can define those heading northeast as being between 22.5° and 67.5° i.e. both have increasing relative strength and momentum (good), whereas those moving in a southwest direction (between 202.5° and 247.5°) have the opposite (bad).
We can also break up the remainder of the ranges as follows:
North – between 337.5° and 22.5°
East – between 67.5° and 112.5°
Southeast – between 112.5° and 157.5°
South – between 157.5° and 202.5°
West – between 247.5° and 292.5°
Northwest – between 292.5° and 337.5°
These can be scripted as follows, and when the condition is true the IF() statement assigns a value, such as Southeast = 4, with the other IF statements being false (giving a result of zero):
//Get Heading Values
V1 = JDKRS().Heading;
//Define Ranges and assign values
N1 = IF(V1 > 337.5 or V1 < 22.5,1,0);
NE = IF(V1 > 22.5 and V1 < 67.5,2,0);
E1 = IF(V1 > 67.5 and V1 < 112.5,3,0);
SE = IF(V1 > 112.5 and V1 < 157.5,4,0);
S1 = If(V1 > 157.5 and V1 < 202.5,5,0);
SW = IF(V1 > 202.5 and V1 < 247.5,6,0);
W1 = IF(V1 > 247.5 and V1 < 292.5,7,0);
NW = IF(V1 > 292.5 and V1 < 337.5,8,0);
//Sum values
N1+NE+E1+SE+S1+SW+W1+NW
When added as a watchlist column the values can then be used in the conditional formatting for labels and/or colours: