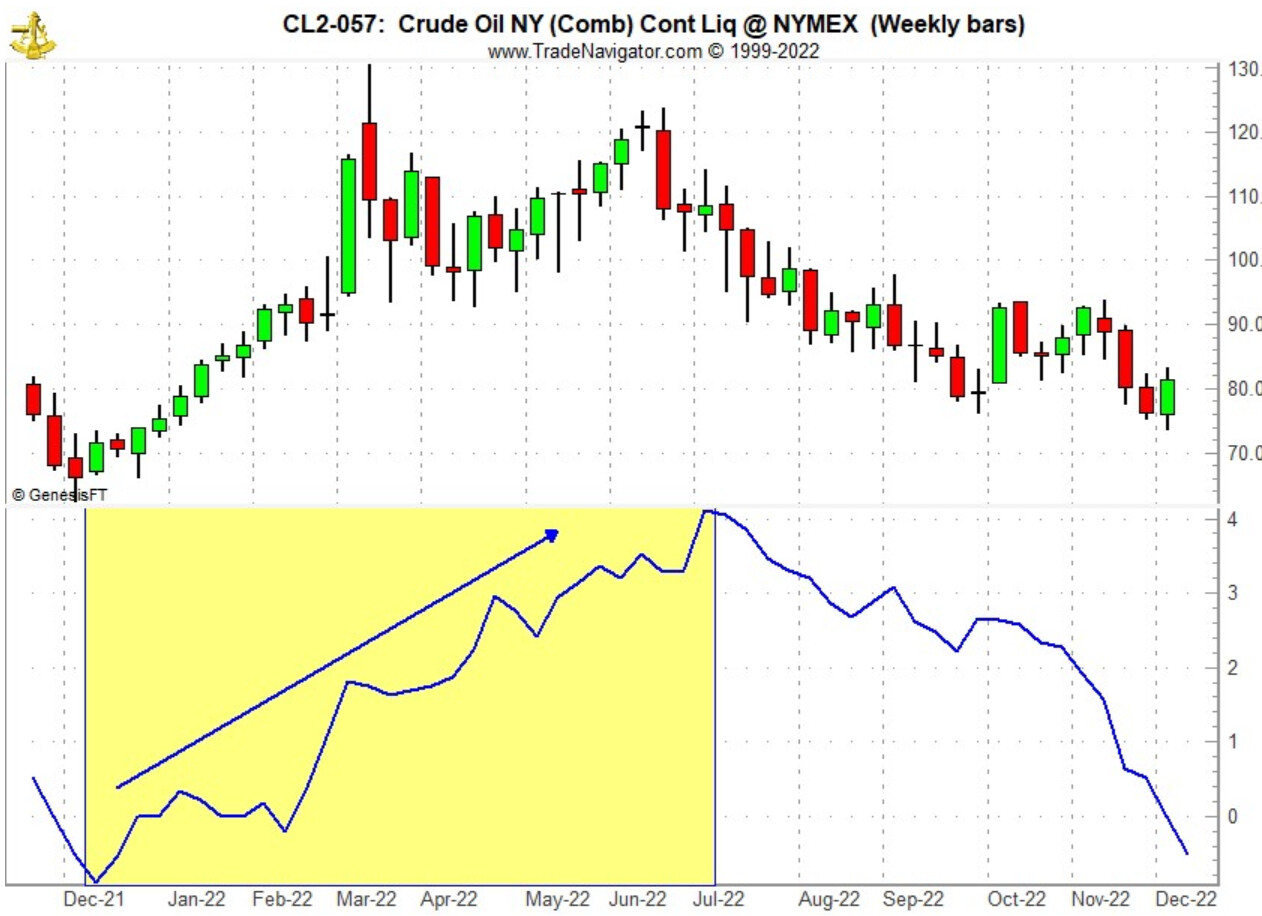
I’m aware of the ability to chart Seasonals and like the feature. I’d love to have the ability to plot them as an indicator such as seen below:
Hi Edward,
You can customize the gann mass pressure tool to achieve this.
Jeff
I do not subscribe to the Gann Module and do not see that indicator available but thank you for sharing that- I guess that means its already built which is a good thing!
[postquote quote=70009]
I tested this and I don’t think you can in the same way he’s suggesting. care to share your chart as I couldnt replicate it.
Hi Jonathan,
I did not attempt to recreate the chart as I don’t have the same data they are using.
A few things to note imo:
When doing this style of seasonal chart with futures, it’s really important to pay attention to how the price history is constructed (such as price adjusted vs ratio adjusted, etc). If the price history keeps the gaps, the seasonal chart may not be accurate as it may show abnormalities during the roll times. Also, if the adjustments produce negative price history, that can become an obstacle as well. These are serious considerations as one method may only get accurate percentage returns and the other way the returns are off but the price difference is correct.
The gann mass pressure tool calculates daily returns and averages all the samples together. I do not know how the trade navigator tool calculates but I’m assuming it’s somewhat similar. Also, the tool properties manually need to be adjusted such as adding in years “1, 2, 3, 4, etc” since it’s pre-set with the mass pressure years (10, 20, etc.)…
Hope that helps…
Jeff