Selling Climax

Hi,

A selling climax is when a stock makes a 52-week high and then closes down for the week (i.e., the close for this week is lower than the close for the previous week).

I created the following script for the Selling Climax using variables:

52wH = CLOSE() > HIGHESTHIGH(Close(), BACKTYPE=Weeks, BARS=52);
WkDn = CLOSE() < CLOSE(Week(PERIODAMOUNT=1), OFFSET=-1);

52wH and WkDn

However, when doing a scan and then spot checking the list of stocks that resulted from the scan, this script is not correct.

I’ve looked through the Knowledge Base, the Forum and viewed the relevant Scripting tutorials, but have not yet this figured out. Any help would be greatly appreciated.

Thanks - Paul

This script I included would be a Buying Climax

Hi Paul,

Do the criteria occur on the same bar? Or does the high get taken out by one bar, then the close is lower than that bars close the following week?

The script below is the first setup, where they occur on the same bar, the other setup would be trickier.

This script has been designed to be ran on a Weekly time frame scan / weekly chart…

V1 = High() CrossesAbove HIGHESTHIGH(BACKTYPE=Weeks, BARS=52) ;
V2 = CLOSE() < CLOSE(1) ;
V1 and V2

On the chart the result looks like this:

Ex4

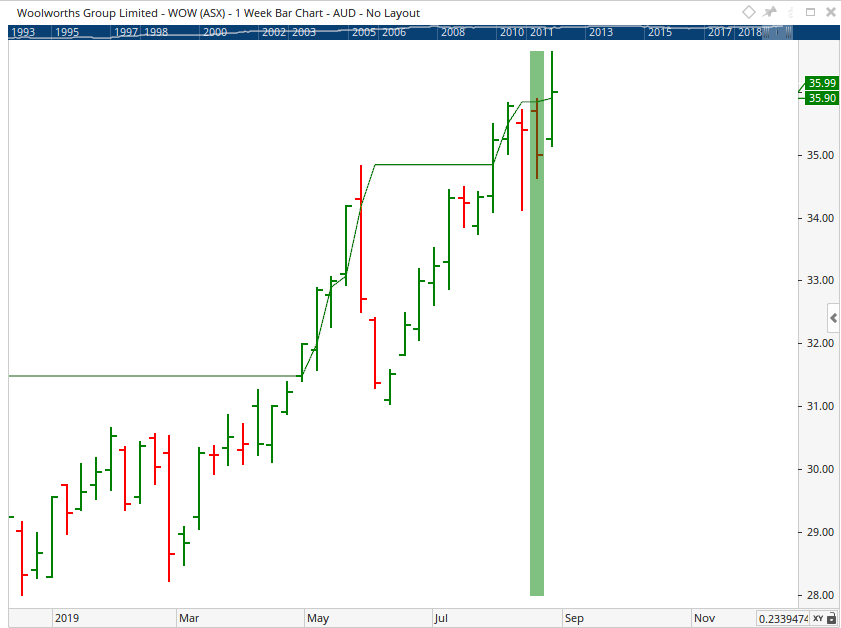
The green line is the 52 week high, and the shaded green section is the bar that passes (New 52 week high set, Close is lower than previous weeks close).