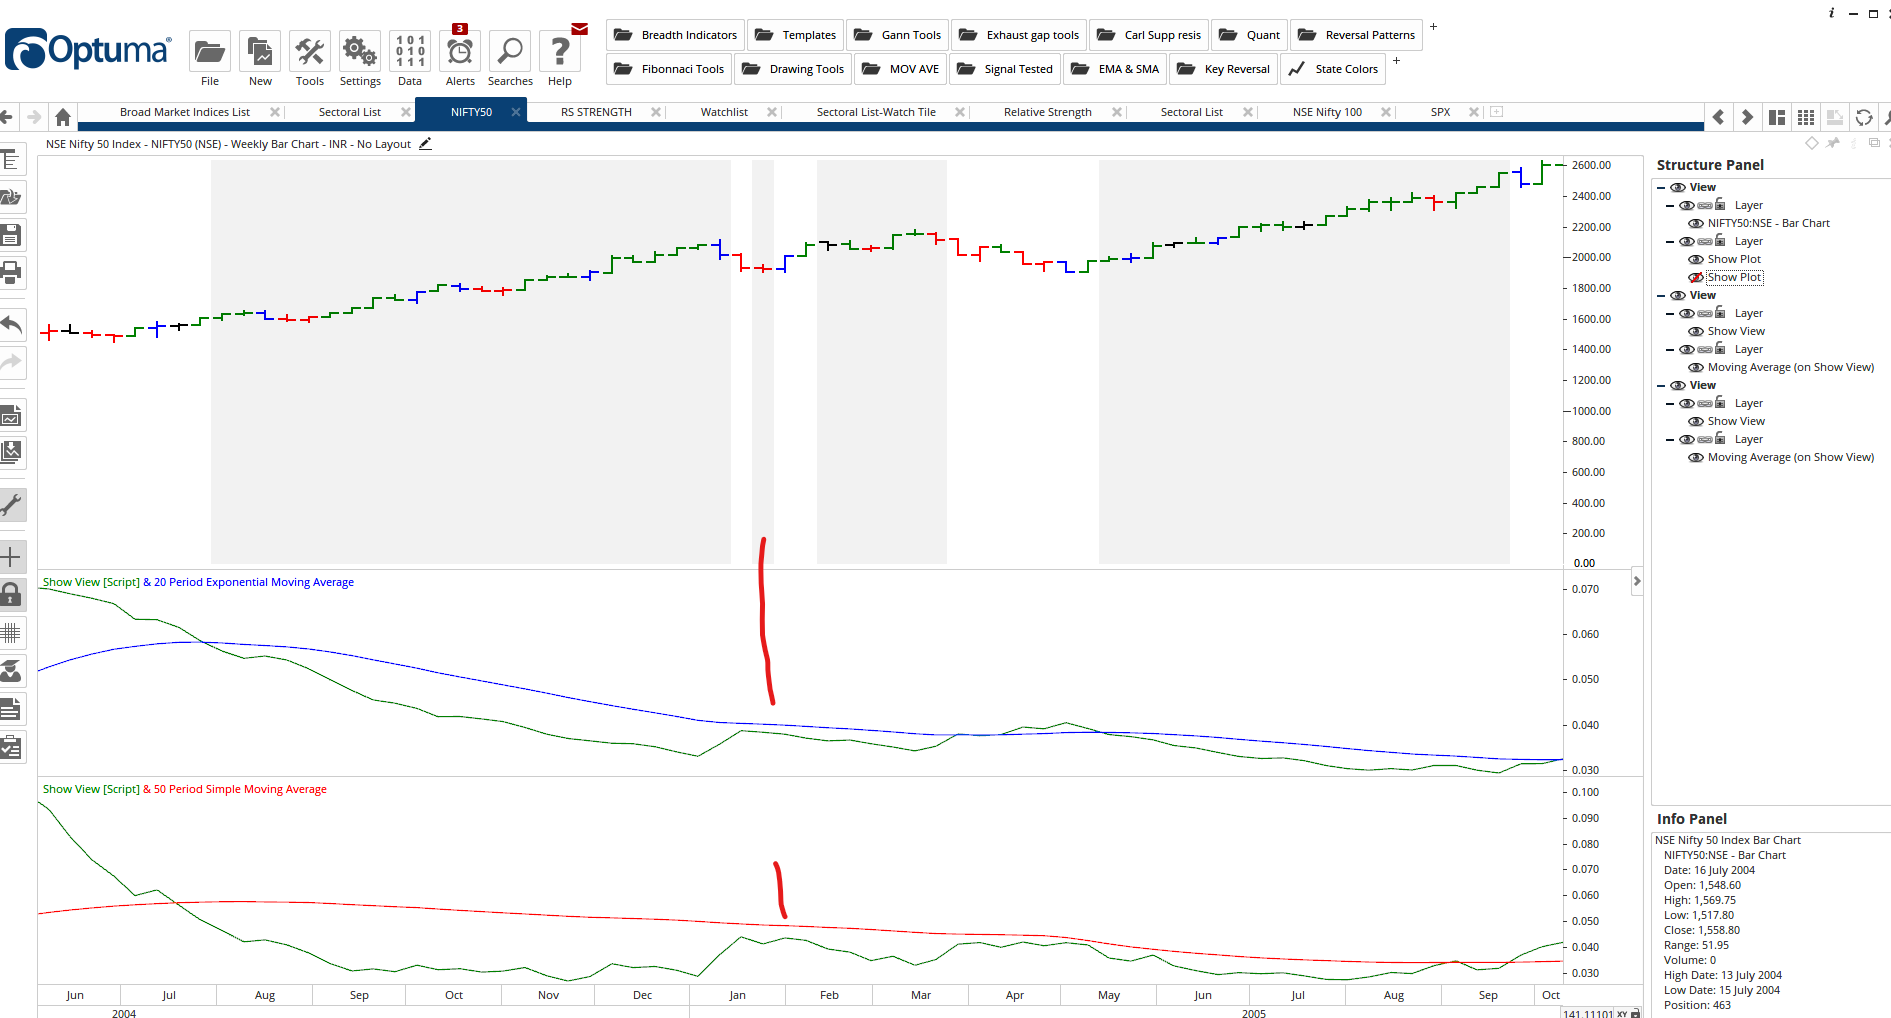
I am using below script in show plot and actual signal which is shown in show view.
Its ATR % & MA of ATR %. In the attached file you can see red highlighted space where show plot indicates a true condition whereas showview does not.
Regards,
Deepak
In your screen shot the 50 period Moving Average you have applied to the Show View is Simple, not Exponential. Your script has them both as Exponential, this is the most likely reason for the variation in results. If you adjust the script to a 50SMA, or adjust the tool applied to the show view to a 50EMA, they should align.