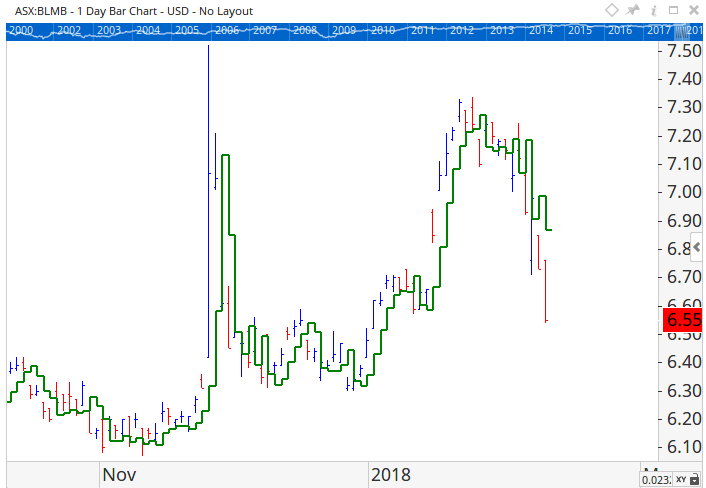
I seek two 3 day simple MA's plotted as stepped lines on the chart, one calculated with High, other Low; to be used as an entry and trailing stop indicator and plotted when close triggers an uptrend or down trend
show plot script MAH = (Simple, high, 3 day); MAL = (Simple, low, 3 day);
thought an if statement could decipher between plots but both lines are plotted
so I get both plots, and I'm guessing its just taking the plot definitions and not considering the if statement. I tried putting the plot def into the IF statement and get do lines...
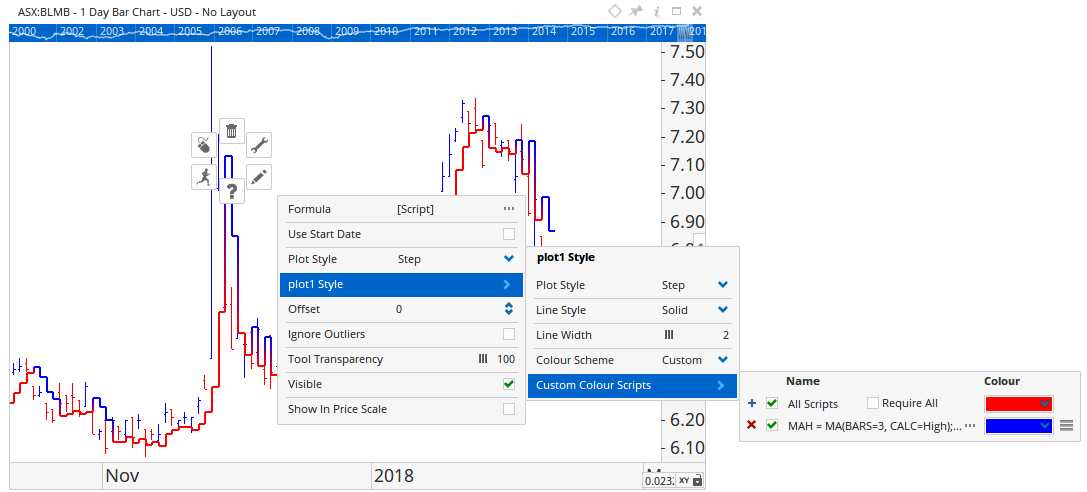
The plot1 and plot2 lines will bypass the If statement and plot the functions they are assigned to. If the idea is to swap between the Low / High MA you need just 1 plot, the IF function will handle the swap between the two.
MAH = MA(BARS=3, CALC=High);
MAL = MA(BARS=3, CALC=Low);
plot1=IF(Close() < MAL, MAH,MAL);
plot1.Plotstyle = Step;
You can then setup the Show Plot to use a custom colour scheme so that when MAH is used it’s blue and MAL it’s red.