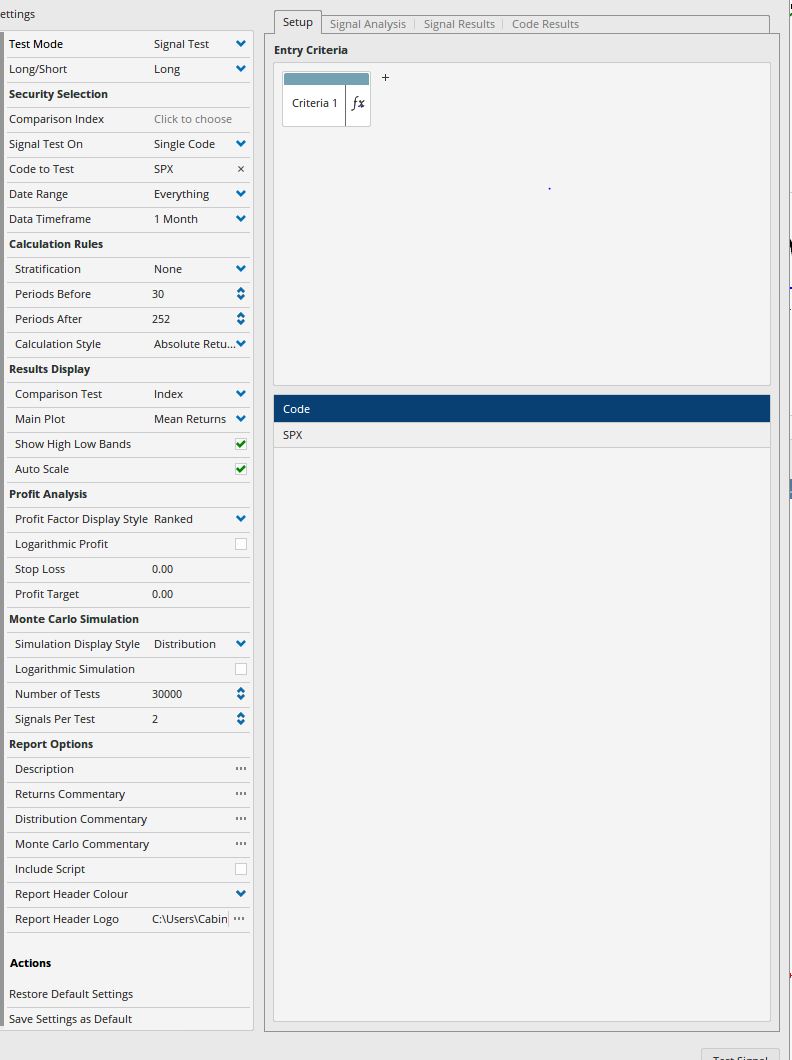
I have a chart with a script that shows when PPO (1,10) crosses above -5 and than 0. It shows when this occurs on top chart. When I use the signal tester i get different results? The signal tester is giving a lot of false signals? What am i doing wrong?
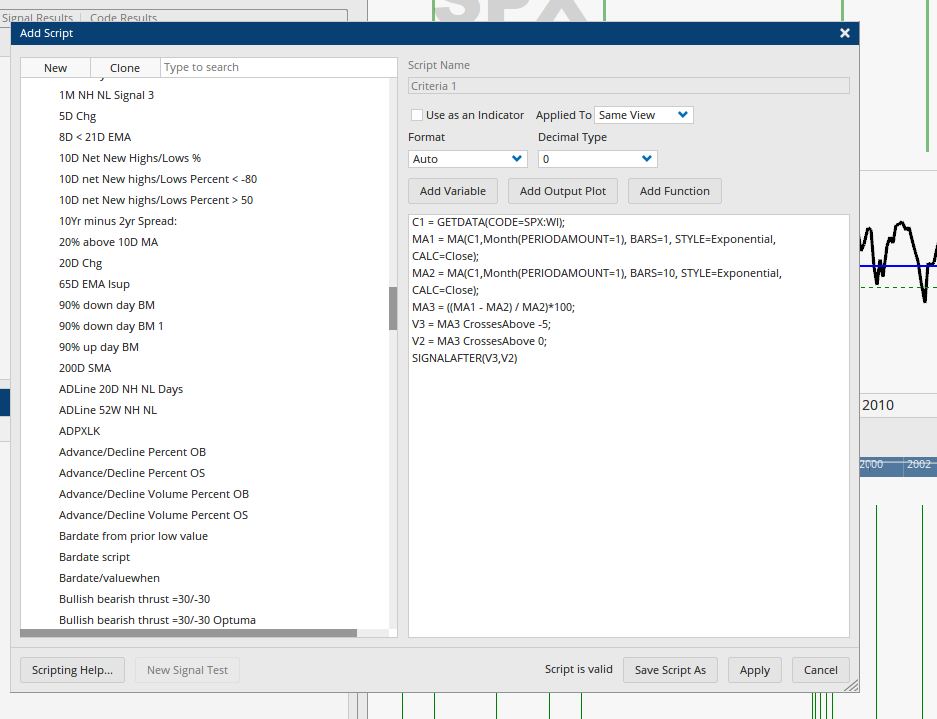
I think the issue occurs when it crosses above -5 and zero in the same month (eg Jan 2019) - so the SIGNALAFTER isn’t showing until June when it next crosses above zero.
To fix, click on the SIGNALAFTER() text and tick the Include Same Bar option:
Also, note that the PPO tool and function was added in a previous release, so there’s no need to calculate it any more: