I've created a script to scan where Stochastic %K is in the over-sold zone i.e., %K < 20 and has recently started to turn-up in last 1 day as per the below script.
//Stochastic is in the over-sold zone %K < 20 and has now started to turn-up in last 1 day //And price is > MA150 //Create variables for the MA values MA1 = MA(BARS=150, CALC=Close); STO = STOCH()
// Create logic formula STO.%K < 20 and STO.%KTurnsUp and CLOSE() > MA1
However I've noticed there is another function STOCHSCAN() similar to STOCH() though I'm unable to get the desired results when I use STOCH() or STOCHSCAN(). When I use a normal MA50 > MA150 scan and add a stochastic indicator on chart I'm able to identify the correct desired pattern. Appreciate if someone can let me know if I'm missing anything here in the above script.
there needs to be a semi-colon at the end of variables ie STO=STOCH();
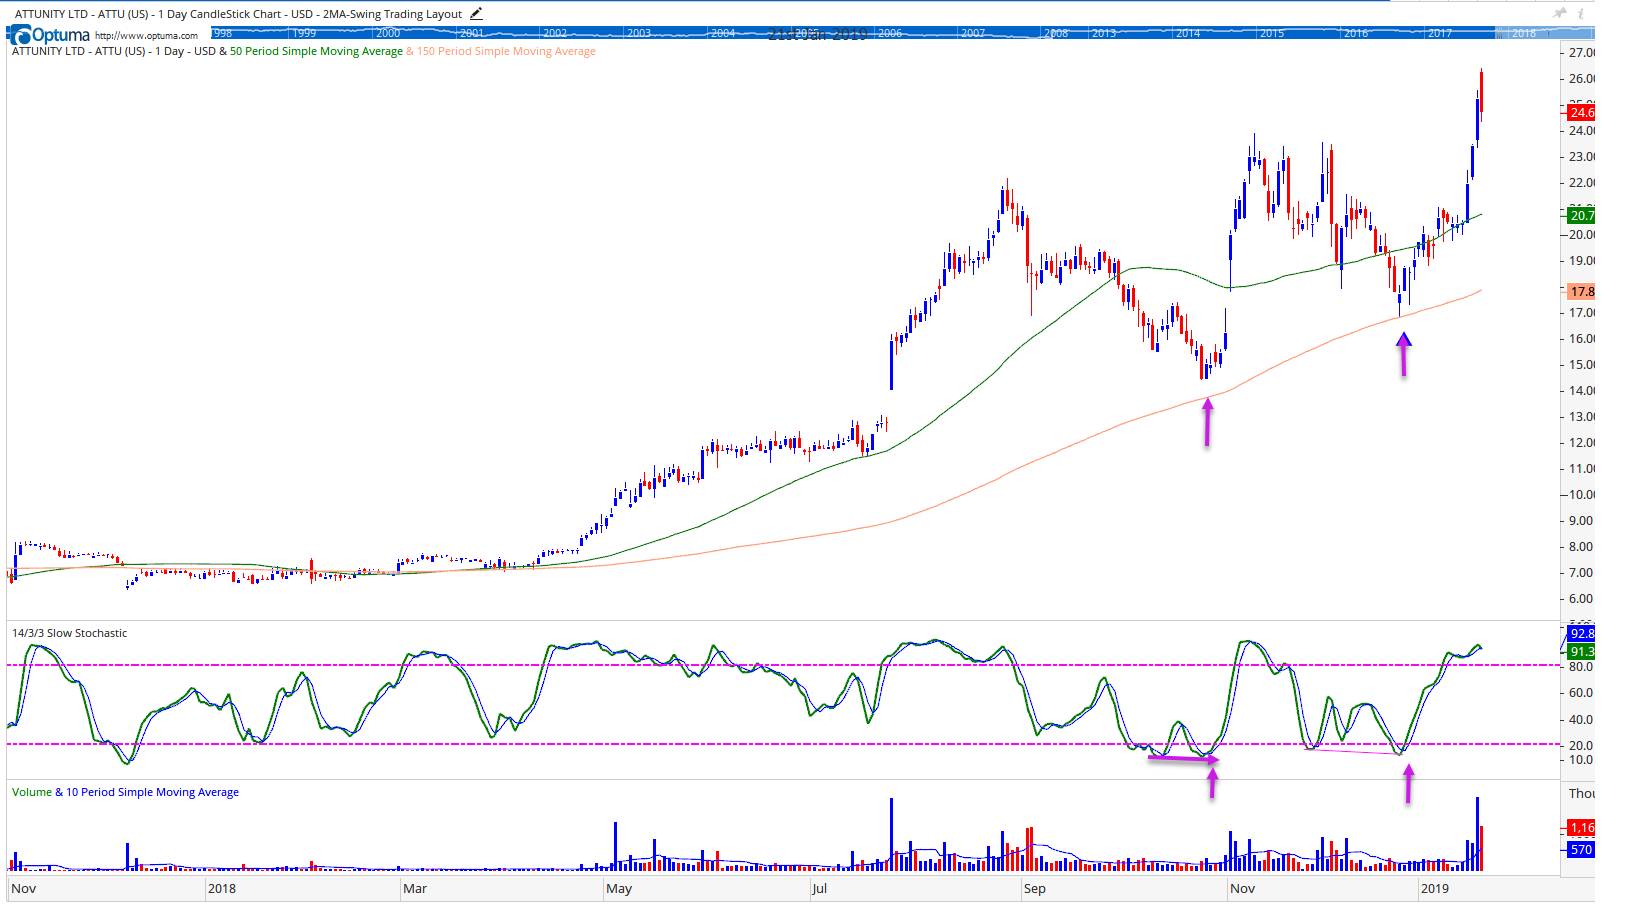
The indicator on the chart and the script aren't matching. By default, the STOCH() function uses the Fast plot set to 10, 3, 3, and the indicator in your chart is using the slow stochastic 14/3/3. Click on the 'stoch' text in the script editor window to change the Type to Slow and Base Stochastic to 14:
Then apply to a Show Bar and the results should match the indicator (tip: change the Show Bar from arrow to a line, and Show over All Views).