Time Count Scan

We’ve been working with Alan Oliver at TradingWithGann.com on a formula that counts bars and calendar days since a pivot high or low.

Here’s a formula for a watchlist column to show the number of bars since a major low - using the PIVOTS() function:

//Identify 15 bar pivot low
V1 = PIVOT(MIN=15, TYPE=Low, IGNOREUNCONFIRMED=True);
//Count bars since v1 was true
TIMESINCESIGNAL(V1)

To count from a high change the pivot type to high, and for calendar days change the last line to use days instead of the default bars:

Capture2

So in this example AMC is currently 51 trading days (TDs) and 77 calendar days (CDs) since the low on December 21st:

Capture

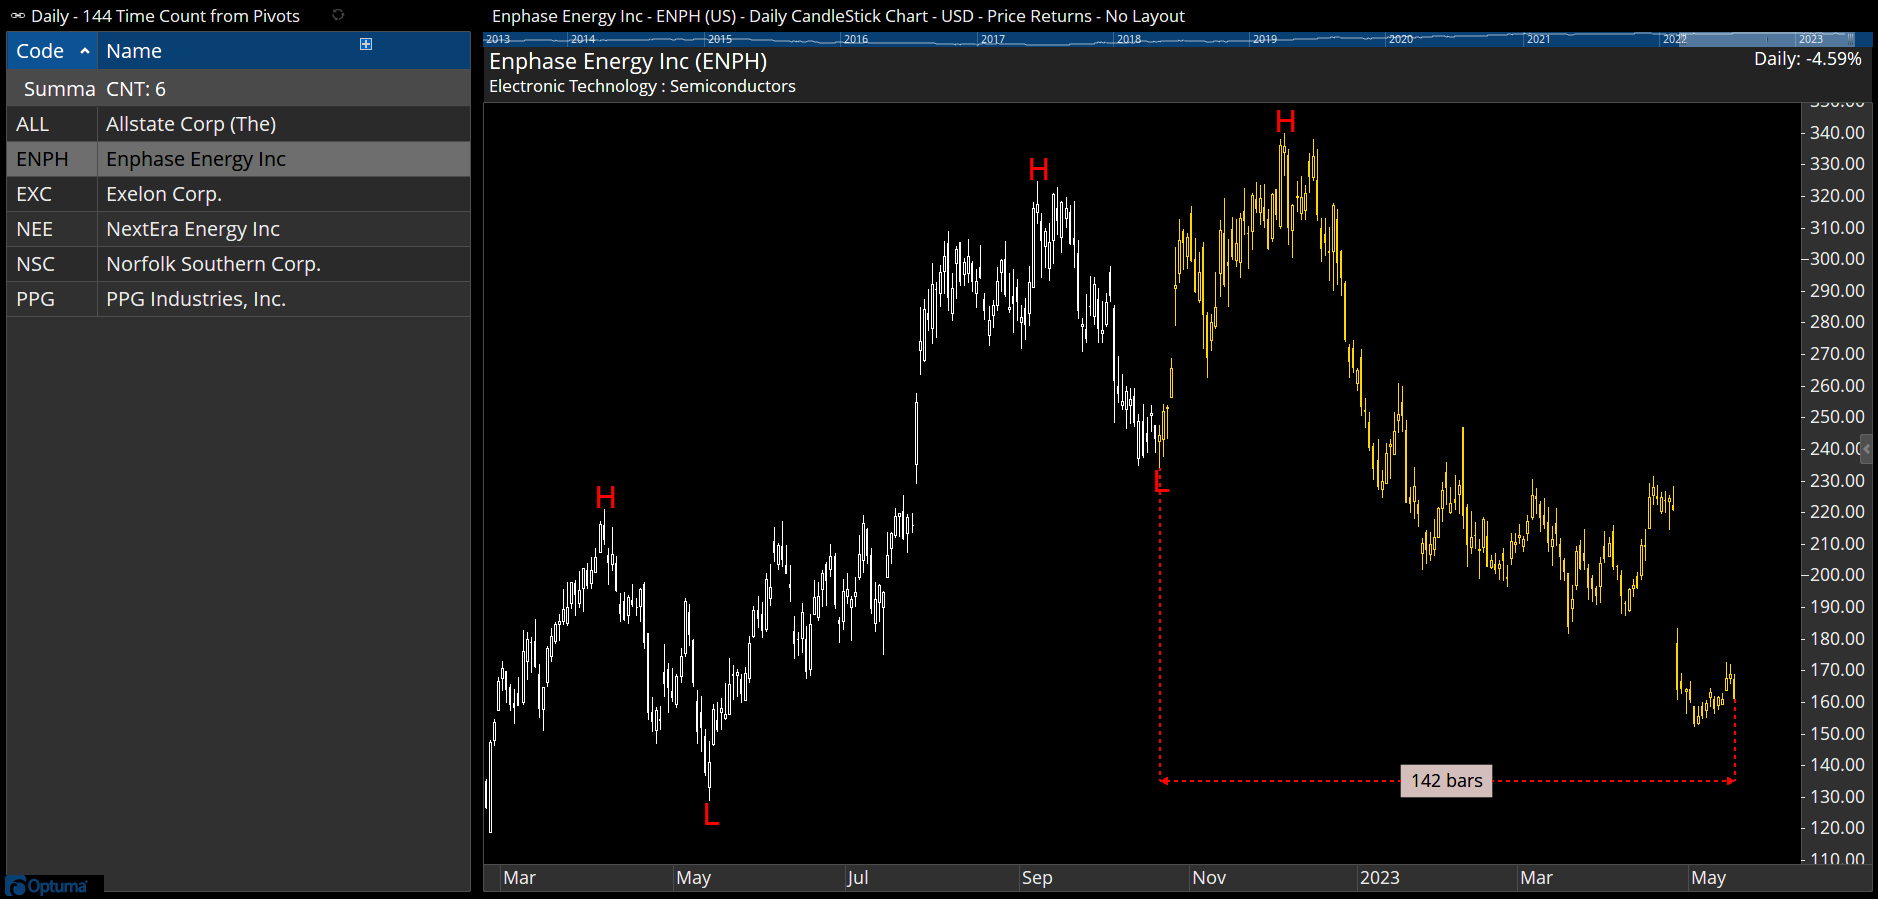
//144 was one of WD Gann's favourite time counts. This finds 142 trading days from any pivot to give a couple of days warning. Charts must be bars only, no filters for Cal days or holidays etc;
//Set Pivot Label value (the higher the value, the more significant);
$Pivot=30;
//Set Timecount required ie 142 days;
$TC=142;
//Get Pivot signals (high ==1, low == -1);
Piv1=PIVOT(MIN=$Pivot, DIR=Both, TYPE=Both, IGNOREUNCONFIRMED=True) <> 0;
//Use the Offset function to signal when the pivot occurred $TC bars ago;
OFFSET(Piv1, OFFSET=$TC)

Capture

To highlight the last 144 bars on the chart use the following as a custom colour scheme:

D1=LAST(BARINDEX()); 
BARINDEX()>= (D1-144)

Alternatively, use this to highlight the bar using a Show Bar set to Arrow, Line, Text, or Symbol:

D1=LAST(BARINDEX()); 
BARINDEX() == (D1-144)

Capture

How to count the number of trading days since the 52 week high:

//Set lookback period;
LastYear = DATATOLOAD(RANGE=Years, AMOUNT=1);
//Get HighestHigh value;
H1 = HIGHESTHIGH(LastYear, RANGE=All Time);
//Get BarIndex value of the high bar;
H2 = VALUEWHEN(BARINDEX(),H1 == HIGH());
//Calculate number of bars since;
LAST(BARINDEX()) - H2

To use in a scan to look for eg a 49-bar count change the last line to LAST(BARINDEX()) - H2 == 49.

Capture