Timeframe override: value and plot seem to disagree

Hi, I’ve been working with timeframe overrides a bit recently.

I’ve found something that’s a little confusing, but I might be misunderstanding something so I’m hoping someone might have some advice or insight.

I’ve got a daily line chart of SPX showing the daily close price. Overlaid on that I have a plot of the weekly close using the formula:

CLOSE(Week(PERIODAMOUNT=1))

I've then put the same formula as a custom label on the cursor.

What I’ve found is that the plot of the weekly close formula is different from the cursor value of the same weekly close formula.

This is illustrated with two screen shots.

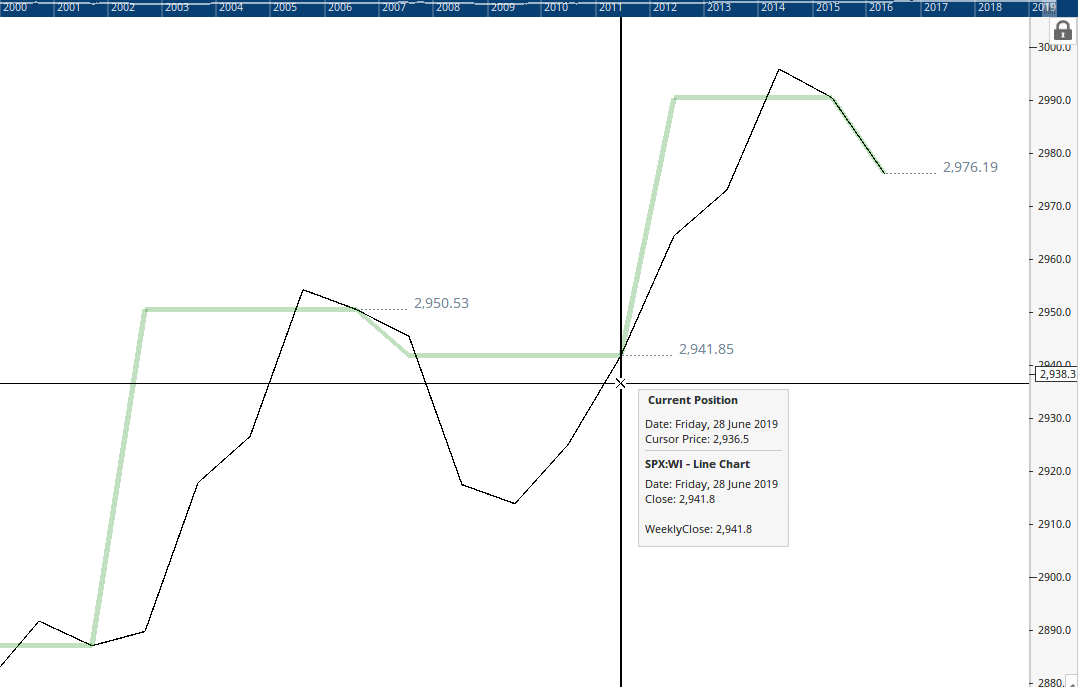
The first screen shot (Friday.png) shows the cursor over a Friday, where the cursor value of the weekly close, the plot of the weekly close (thick green line) and the Friday daily close (thin black line) all intersect, and agree with each other, at about 2941.8. As expected. All good.

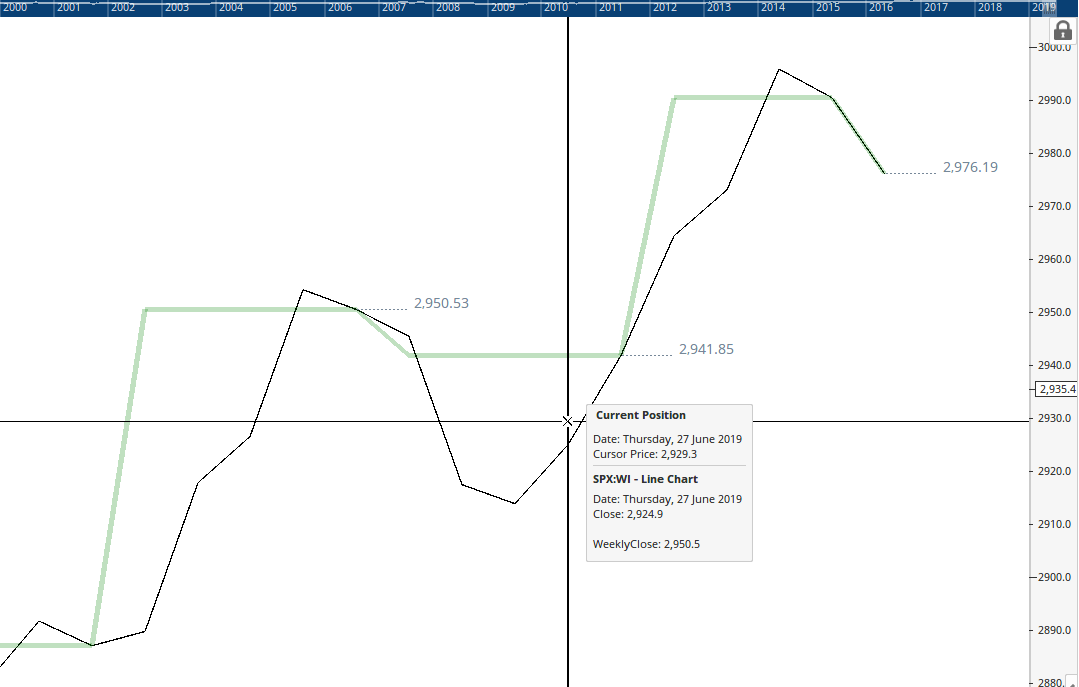
The second screen shot (Thursday.png) is on the day before (Thursday). The daily close has changed to 2924.9. The plot of the weekly close (thick green line) remains at 2941.8. But the cursor value of the weekly close has changed to 2950.5. The cursor value and the plot are different, even though they both use the same formula.

It seems that the cursor value of the weekly close has changed to the previous week’s closing value of 2950.5. That sort of makes sense, but then why is the plot giving a different outcome? Or is it that the plot giving the correct outcome and that the cursor value is in error?

Has anyone experienced something similar or have any advice or insight on this issue?

Many thanks, Dean

Hi Dean,

You are touching on something which has been the bane of my life for the past 24 years. The problem is that the weekly bar just has 4 data points and is dated as Friday. There is a lot of detail missing. Inside of Optuma, you can think of a weekly bar as happening on Fridays with 4 blanks in between.

Because of that, the big issue is when we are mixing Daily and Weekly time frames. In this case displaying a weekly script on a daily chart. It is something that we have to be really careful about.

When you look at Monday in your images, you see that the value of the weekly line is already set to Friday’s value. It’s not that there was a value on Monday, it is just that the algorithm for drawing is joining all the dots (the closes of the week) and that line passes through all the other 4 days.

With the cross hair, the spaces are not filled, so there is no data to return a price for on Mon-Thu. So the software goes backwards to find the last price. In this case it is last week Friday.

We wrestle with this all the time because every solution creates a new set of problems. It is particularly dangerous in testing when I have seen incredible results when mixing daily and weekly, but they were because Friday’s close was known on Monday. I wrote about it in this blog post https://www.optuma.com/the-danger-of-weekly-scripting/

Hope that helps

Mathew.

Thank Mathew.

The blog has demonstrated that the Optuma team have put applied their vast experience to ensure that the dangers of future data being mixed with historical data cannot occur in Optuma. Thank goodness for that and thank you Optuma.

Sorry for persisting, but may I ask for one additional point of clarification yet.

It appears that Optuma evaluates the following script formula differently if being applied to a weekly chart or a daily chart.

CLOSE(Week(PERIODAMOUNT=1))
To illustrate, attached are two screenshots of Optuma in training mode, on a Monday (08/07/2019). The cursors in the screenshots shows the outcome of the formula CLOSE(Week(PERIODAMOUNT=1)) against the WeeklyClose label. One screenshot is of a daily chart, the other is of a weekly chart. Here are the results:

Daily chart on Monday 08/07/2019 (see screenshot Monday on a daily chart.png)

2,975.95 Monday close

2,990.41 Output of formula CLOSE(Week(PERIODAMOUNT=1))

Weekly chart on Monday 08/07/2019 (see screenshot Monday on a weekly chart.png)

2,975.95 Monday close

2,975.75 Output of formula CLOSE(Week(PERIODAMOUNT=1))

Why does the same formula give a different result on the daily chart compared to the weekly chart? Your response and the blog post do not really explain why there should be a difference on the evaluation of the same script formula depending on whether it is applied to a daily or weekly chart.

The blog post warns of the danger of bringing future data into backtesting. Optuma has solved this which is readily confirmed in the above observations (again, thank you Optuma). That is not the issue though. It is the inconsistency of the script’s output that is the issue.

Is there more insight you can offer to help understand why Optuma behaves in this way?

Many thanks, Dean

(PS. This post also gives more narrative on similar observations to the screenshots of this post).