The TimeSinceSignal function is very useful to determine how long has elapsed since a technical event (see here and here for some examples).
Here’s a variation which counts the number of trading days since two moving averages crossed, calculating a positive number when crossing above and a negative number when crossing below. The example is for the 20EMA crossing the 50SMA:
// Calculate the MAs
20EMA = MA(BARS=20, STYLE=Exponential, CALC=Close);
50SMA = MA(BARS=50, CALC=Close);
// Calculate time since the MA cross
r1 = TIMESINCESIGNAL(20EMA crosses 50SMA);
// Is it a cross above?
r2 = 20EMA > 50SMA;
//Multiply by -1 to get negative numbers
r3 = r1 * -1;
//If cross is above use positive r1 value, otherwise use the negative r3 value
IF(r2 == 1,r1,r3)
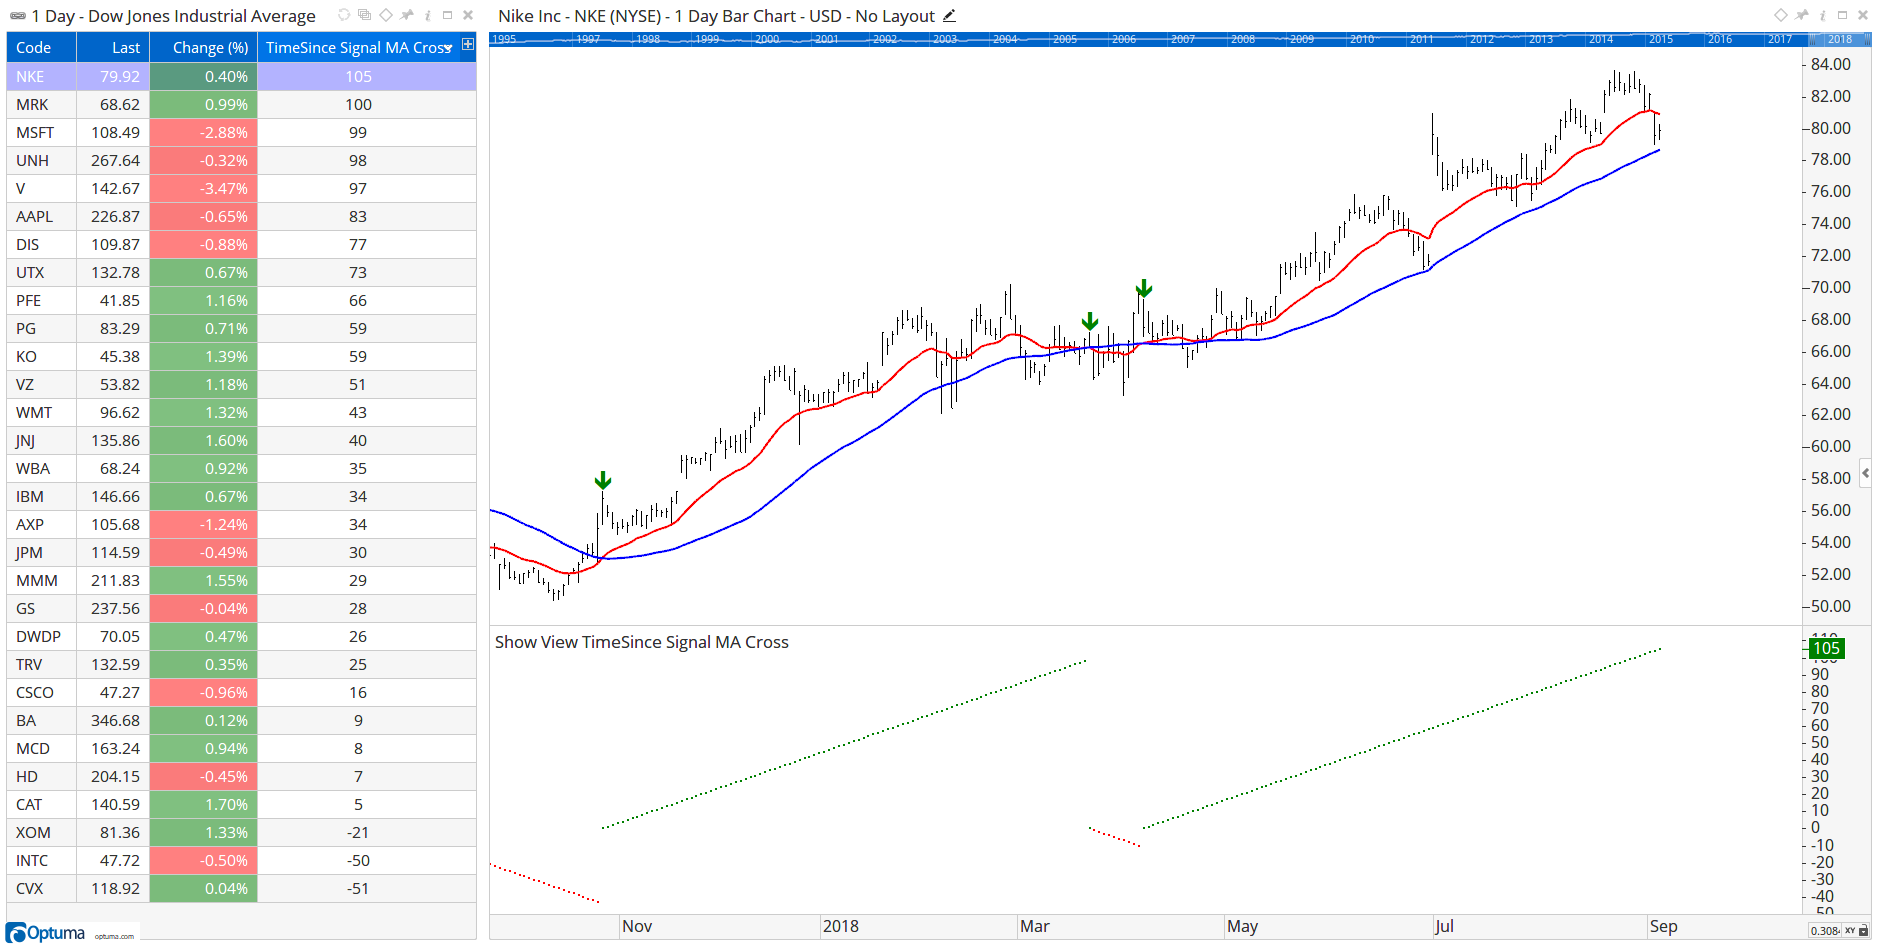
The script can be added to a watchlist column and also a Show View to display the results (note the Show View properties have been set to a Dot plotstyle, with a positive/negative colour scheme):
So NKE crossed above 105 days ago, and CVX crossed below 51 days ago.
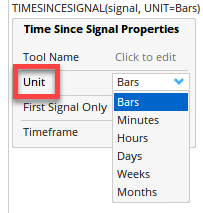
Also note that you can count in calendar days or weeks by changing the Units property in the TimeSinceSignal function:
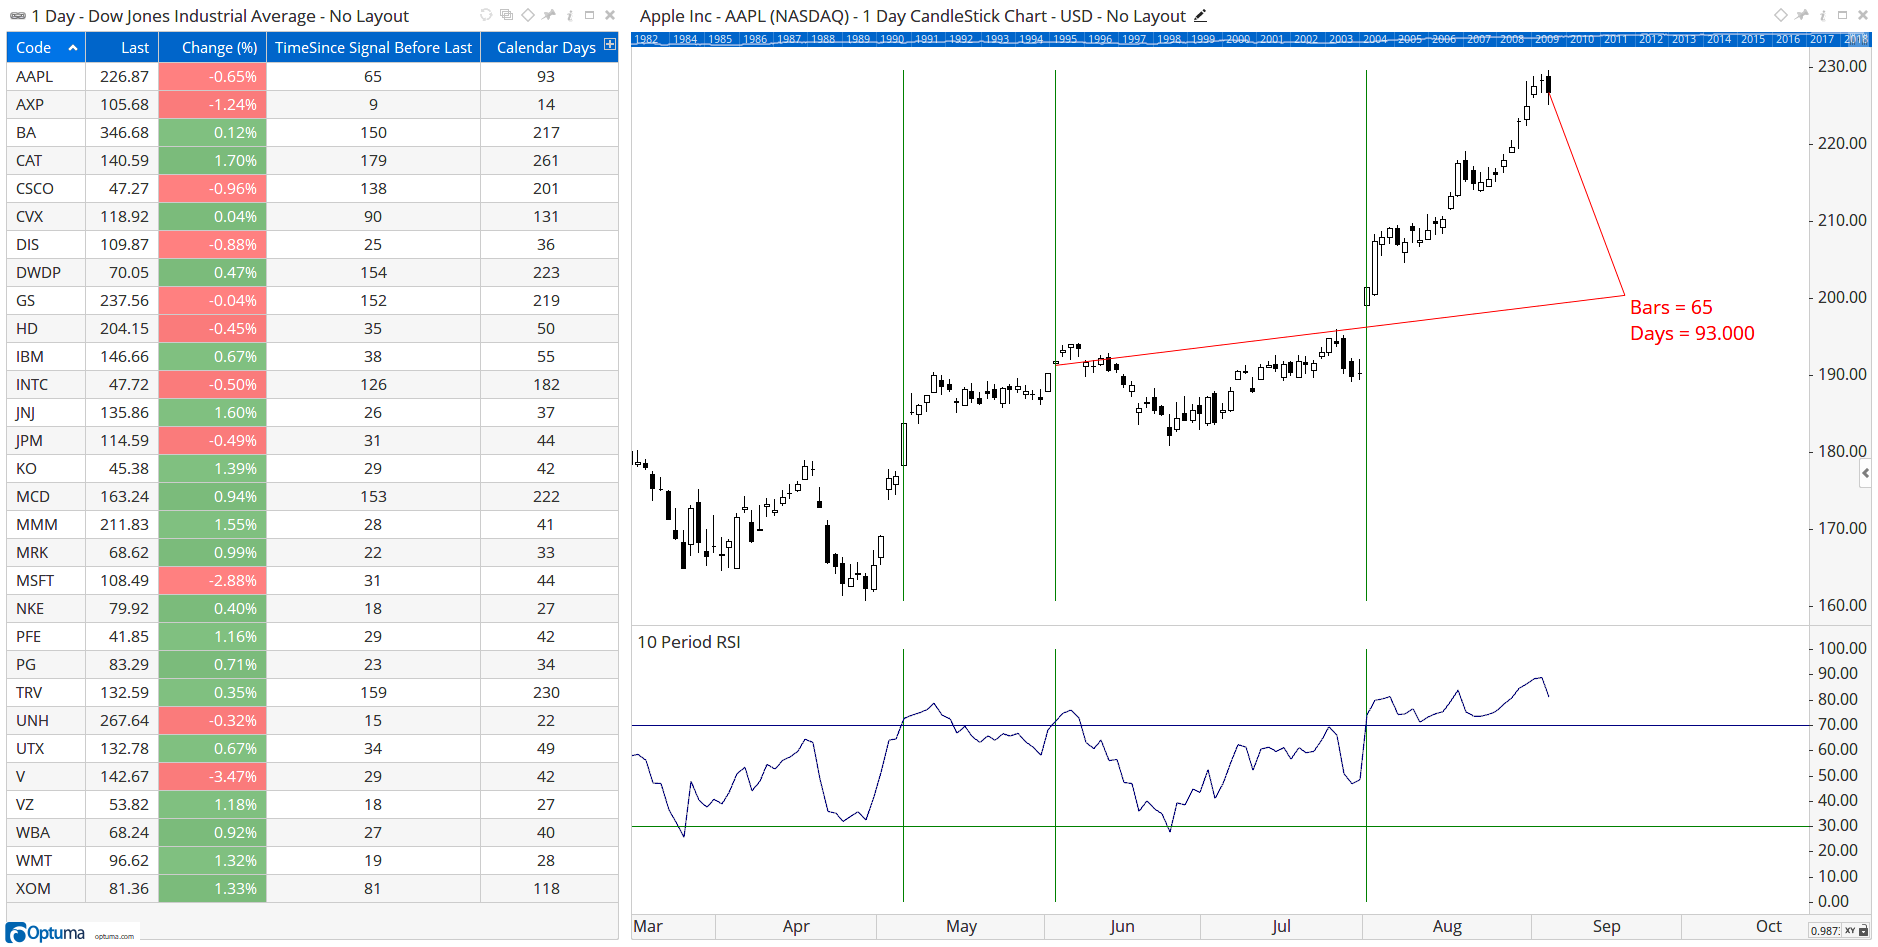
To calculate the time since the signal before last use the following (note: this will return calendar days), in this case RSI crossing above 70:
//Get the signal;
S = RSI() CrossesAbove 70;
//Get the bar date of the signal before last - increase the OFFSET for earlier signals
P1 = BARDATE();
P2 = LAST(BARDATE(NONZERO(S), OFFSET=1));
Signal = P1 == P2;
//Count the bars since the signal
TIMESINCESIGNAL(signal, UNIT=Days)
Thanks everyone at Optuma for all of the help with the scripting. These forums really are incredibly useful.
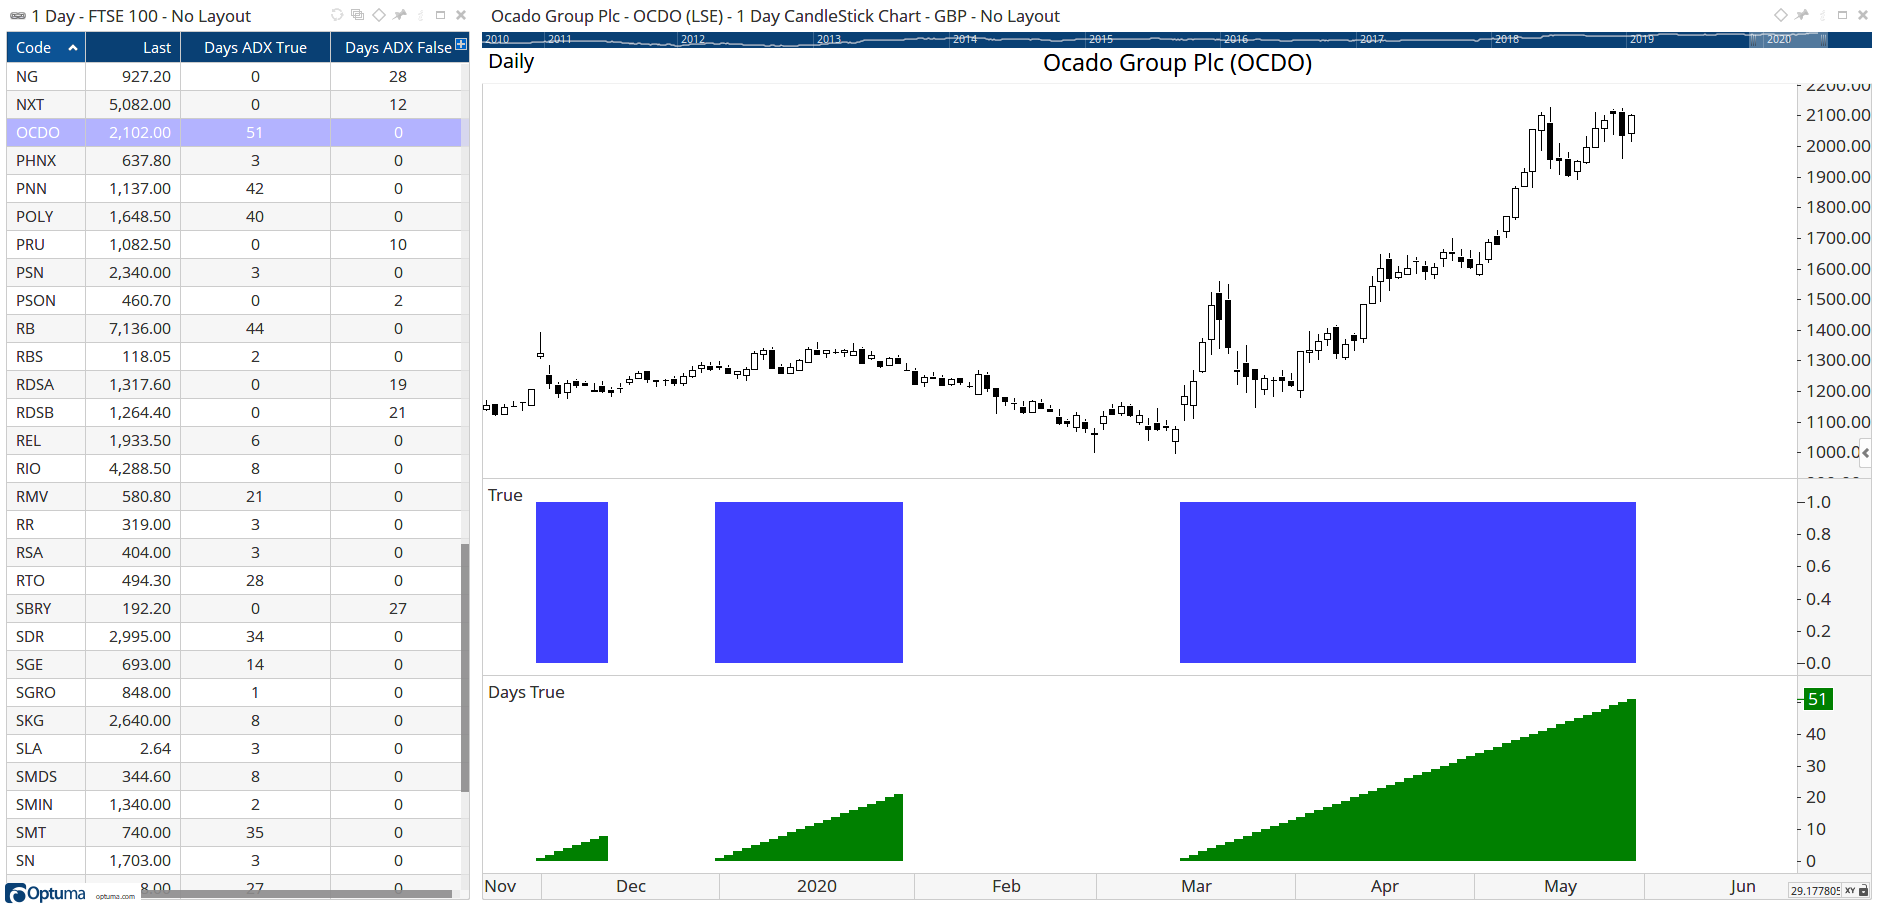
I have a basic script where i am looking for ADX > 14 and DM+ > DM-. I am trying to create a TimeSinceSignal script to return the number of days since these conditions were met. Strangely the script is returning 0 for all stocks where the signal is currently live, and a value for stocks where it is not.
I see the logic in that the script is returning the number of days since the signal ended, how would I correct this to return the number of days since it was triggered?
I think the issue is that you may be counting since the condition was last true - not how long it has been true, hence the zeroes for those where currently true. It’s a bit confusing, but instead you need to count how long it’s been since the condition was last false. Remember that a value of 1 is true and 0 is false, so this will show how long it has been true by counting the days since it was false:
V1=ADX()>14 and (ADX(DEFAULT=DMPlus) > ADX(DEFAULT=DMMinus));
//How long since V1 was last false?;
TIMESINCESIGNAL(V1==0)
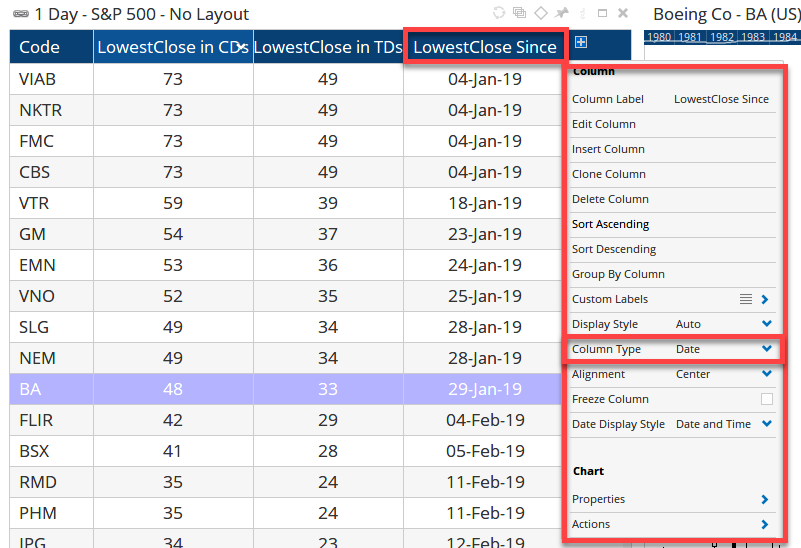
This list of FTSE100 stocks shows when the V1 condition is true in blue on the chart, with the green showing the time counts. So OCDO has been positive for 51 days, whereas the ADX False column shows how long it has been false (in other words how long since it’s been true) i.e. 28 days for NG. Hope that makes sense!