hello optuma!
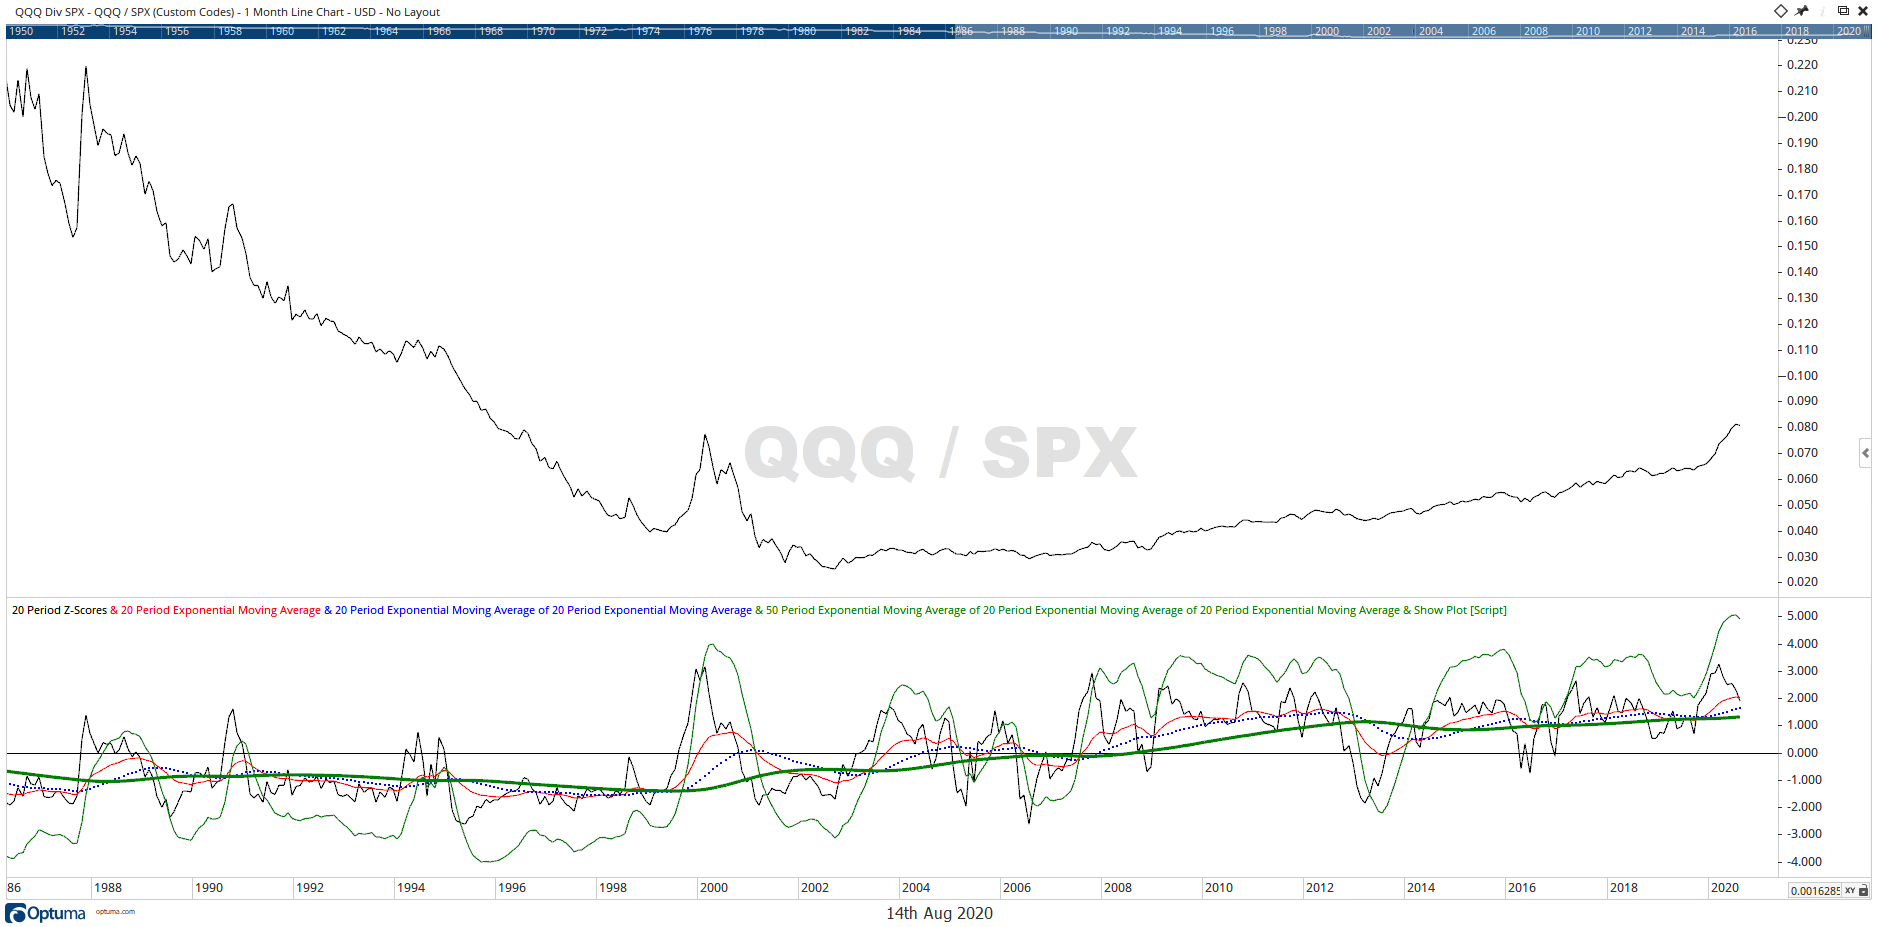
i’m looking to recreate what i call the 3x exponential moving average of an indicator. in this photo, i’m looking to recreate the dark green line in the lower panel. any help is much appreciated!
hello optuma!
i’m looking to recreate what i call the 3x exponential moving average of an indicator. in this photo, i’m looking to recreate the dark green line in the lower panel. any help is much appreciated!
Thanks for the tip Jeffrey… i can’t get it to work on an indicator, just price - and fortunately/unfortunately i’m looking for the ema of the z-score.
Hi Joshua,
Have a look at this video on how to add indicators on indicators.
https://www.optuma.com/videos/how-to-apply-indicators-on-indicators/
Also remember in scripting you can do the same thing using variables
V1 = function1(paramaters);
V2 = function2(V1, other parameters);
V3 = function3(V2);

etc
All the best
Mathew
hello! i’m familiar with the indicator on indicator functions and use them regularly. i’m new to optuma and scripting, but what i’m attempting to do is create a script that i can use in the signal tester. thought that i’d have some fun with the 50 period ema of the 20 period ema of the 20 period ema of the z-score for a particular security. any thoughts welcomed.
Hi Joshua,
See my code example above. Look how I assign a variable V1 and then use that as the input into the next function.
Have you done the free scripting courses at learn.optuma.com? The question you are asking is one of the basic features of scripting. We’re happy to help here when things don’t make sense, but we do expect you to have gone through that course.
All the best
Mathew